Priority Percentiles are determined by the count of valid, non-duplicate submissions a researcher has made in comparison to the rest of the crowd.
Percentiles are based on these Valid Substates: Won’t Fix, Unresolved, and Resolved.
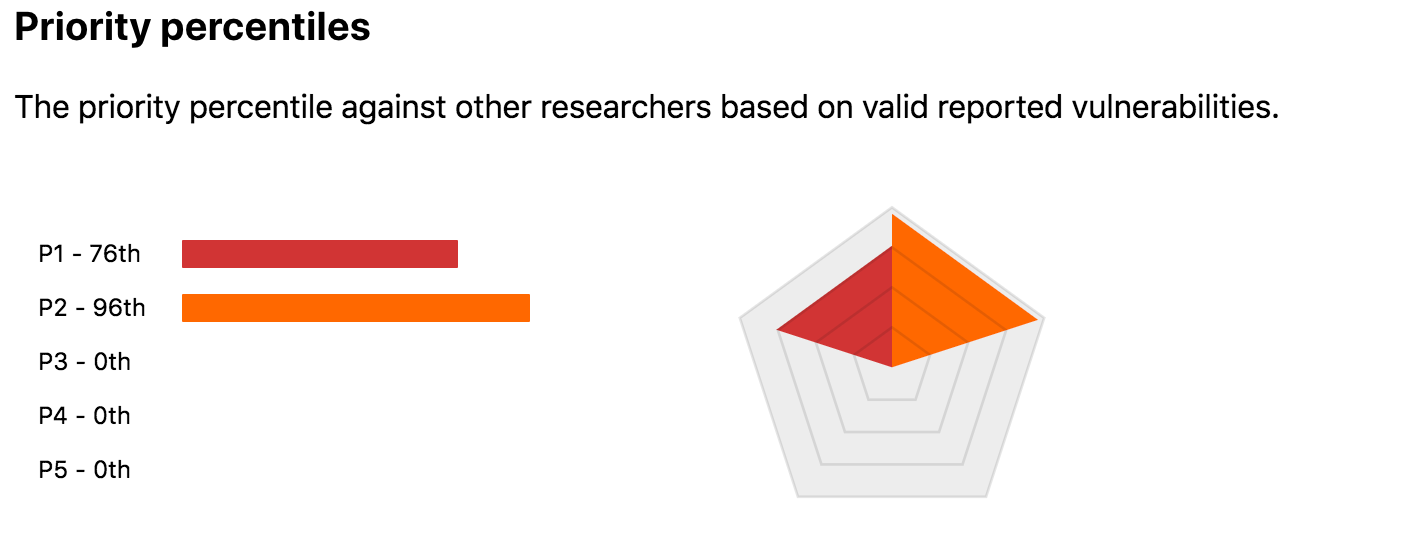
The Priority percentiles section displays both a graph and visual diagram displaying a researcher’s percentile relative to all other researchers. It shows the following:
- All five priority levels, displayed as a different color: P1, P2, P3, P4, and P5
- Displays the percentile level in relation to all Researchers. The size of the bar and the percentile value indicates the percentile level.
Each percentile is a comparison of a researcher’s submission volume to all other researchers over a specific period of time; the higher the percentile, the more submissions the researcher has for that priority level compared to others.
You can view the priority percentile over time or within a certain time frame such as last 90 days. The All time metrics are displayed by default. Click the Last 90 days tab to view the priority percentiles for the last 90 days.