- Understanding the Industry Comparison Report
- Generating Industry Comparison Report
- Reading the Industry Comparison Report
Understanding the Industry Comparison Report
The Industry Comparison Report provides a comparison of your program or engagement’s performance by benchmarking against a relevant industry. This helps your organization improve performance, identify methods of improving operational efficiency, and your company’s relative cost position against the industry.
You can view a snapshot of your program or engagement health that includes the submissions and funds for a given time period.
The report provides the following information per quarter:
- Number of submissions
- Priority of submissions
- Unique researchers
- Number of rewards
- Number of accepted submissions
- Number of fixed submissions
- Payout by submission severity
Note: Only the Program Owner can generate this report.
Generating Industry Comparison Report
To generate an Industry Comparison Report, follow these steps:
-
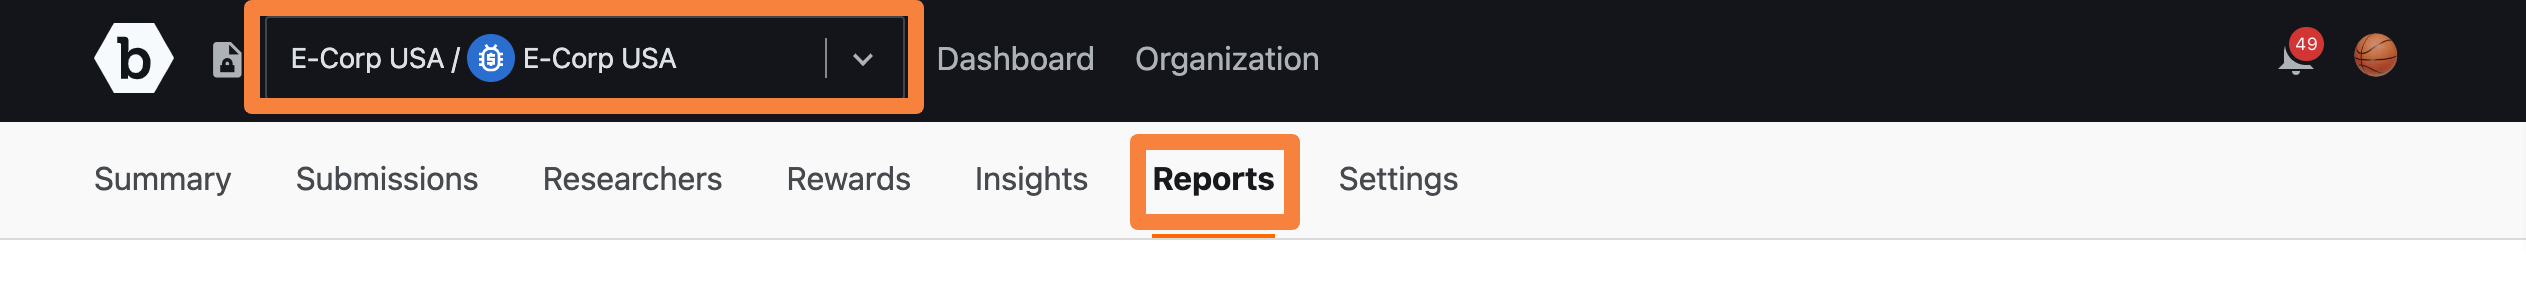
After logging into Crowdcontrol, select a program or engagement from the drop-down menu, and then click the Reports menu. The Reports page is displayed.
-
Click Generate report and then click Industry Comparison Report.
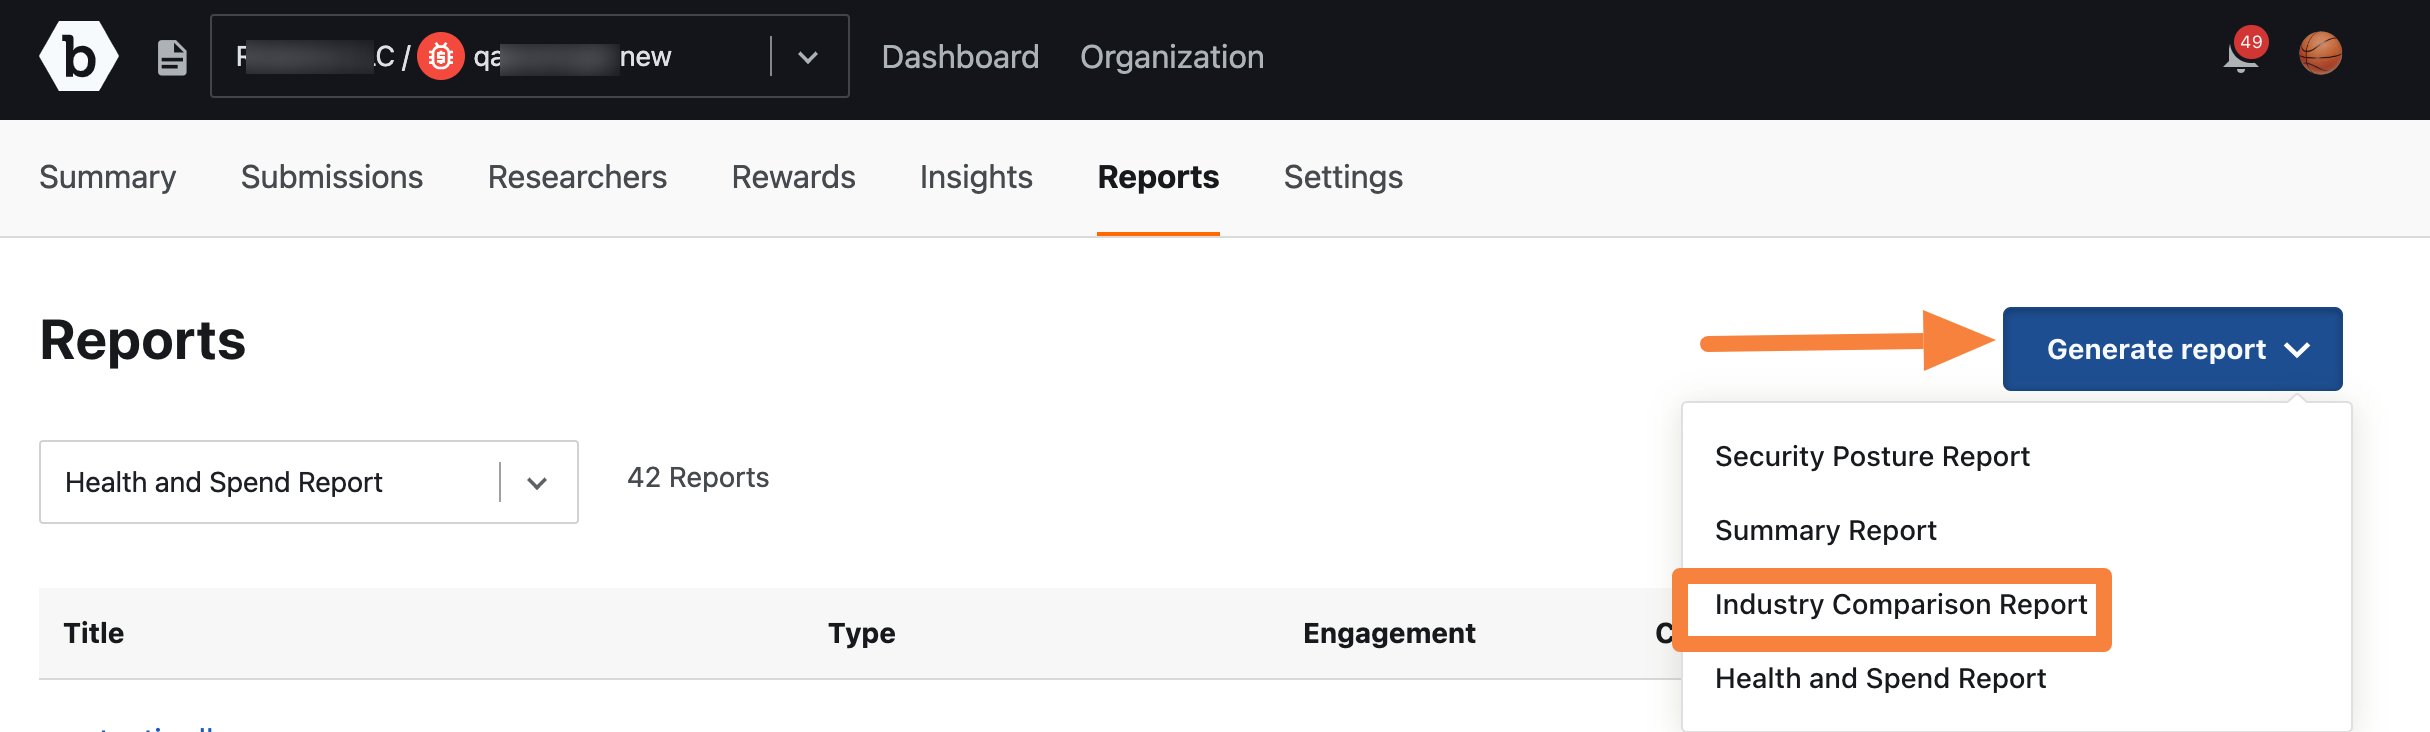
The Create Industry Comparison Report page is displayed.
-
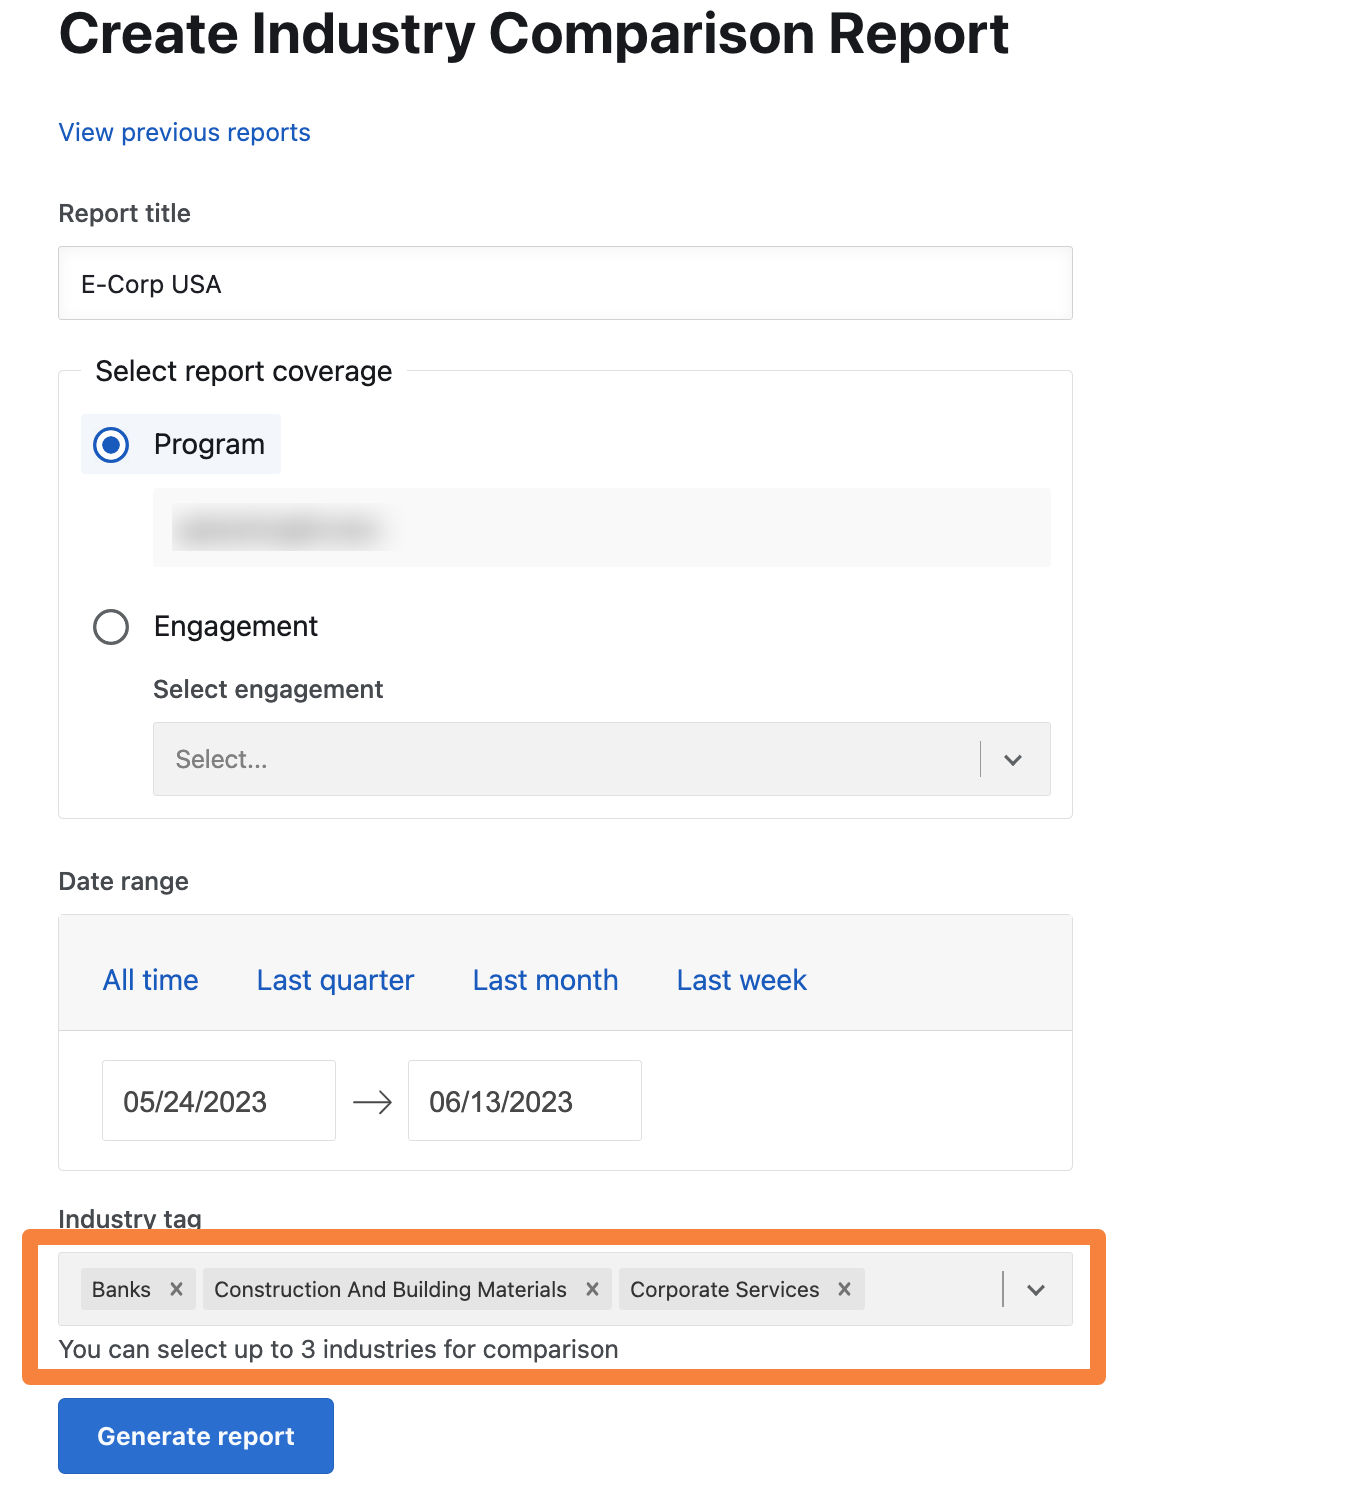
Specify the following information:
- Report title: Provide a name for your report.
- Select report coverage: Displays the program or engagement name for which you want to generate the report. The Program field is read-only, and the Engagement field allows you to select an engagement.
-
Date range: Specify a data range for generating the report. You can also click any of the following to specify the date range:
- All time: Includes data since program or engagement was launched.
- Last quarter: Includes program or engagement data for the last three months of the previous calendar year.
- Last month: Includes program or engagement data for the first to last day of the previous calendar month.
- Last week: Includes program or engagement data for the last week calendar date from Monday to Saturday.
-
Industry Tag: Provide the industry name. You can now select up to three industries for comparison.
-
Click Generate report. You will receive an email to download the report.
The generated report is displayed as a link on the Reports page. Refresh the page to view the link.
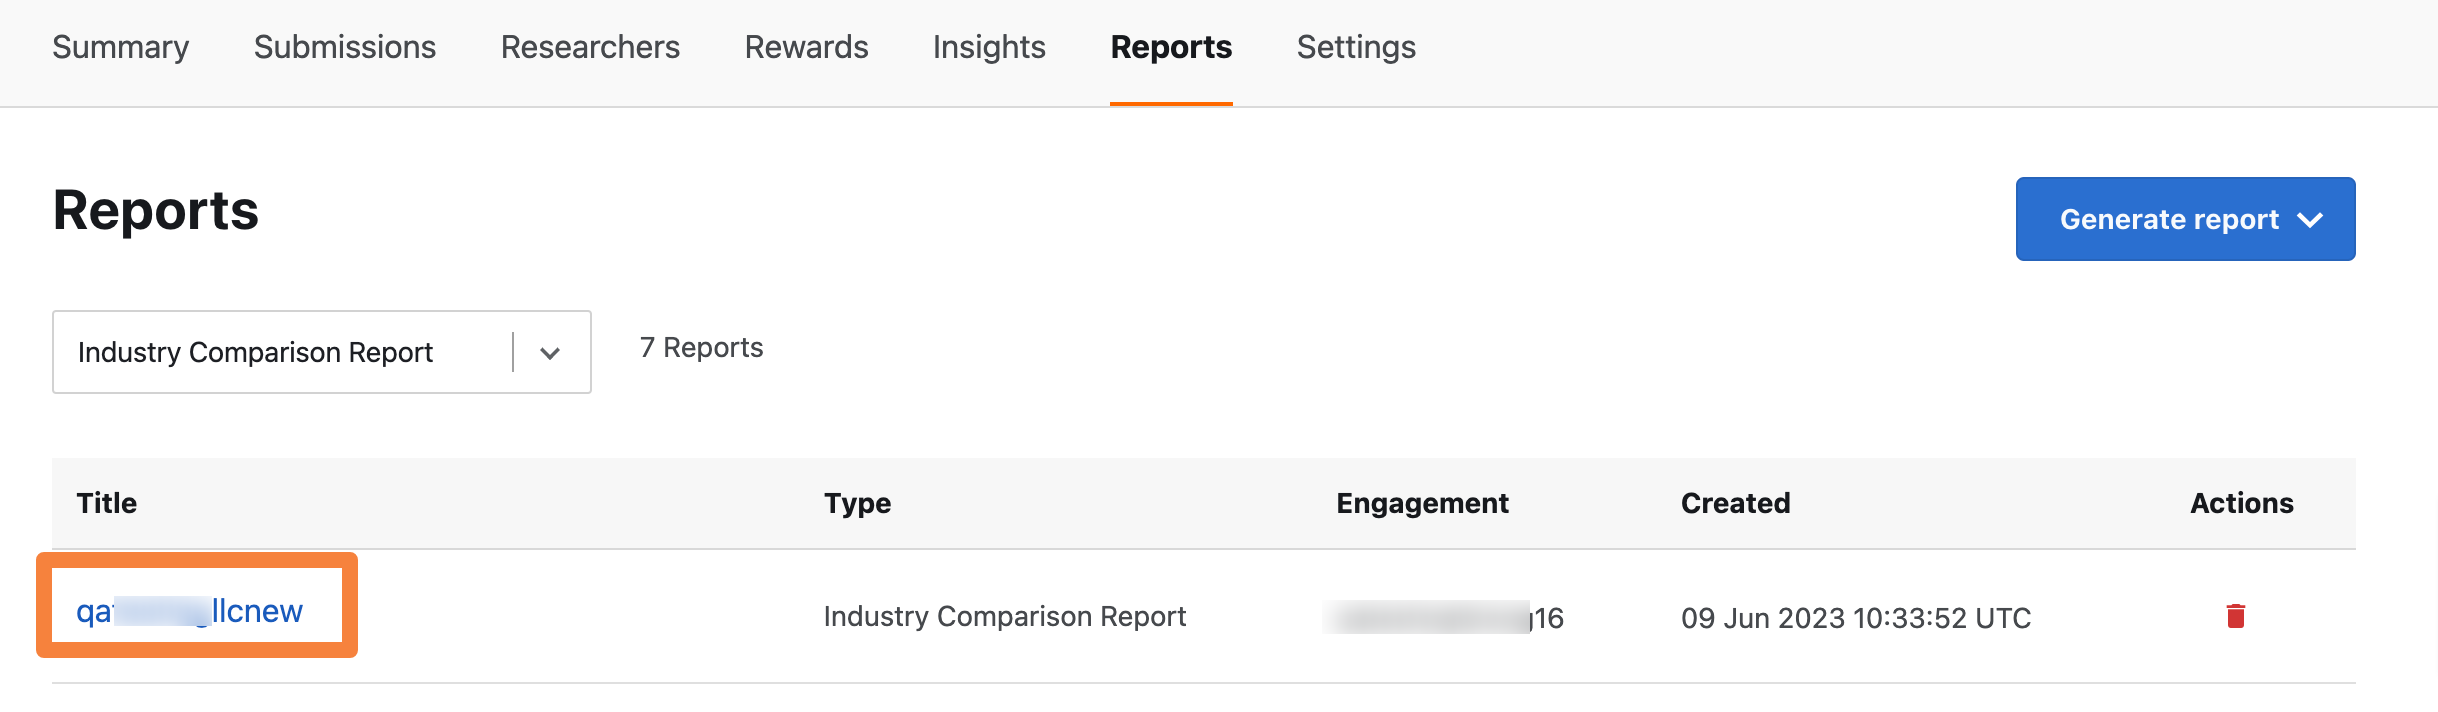
Note: The report title link is active only after the PDF report is generated.
-
Click the link to view the report details. The link opens the report on your system’s browser. You can view, download, and print the report.
You can also view, download the report from the link received in your email.
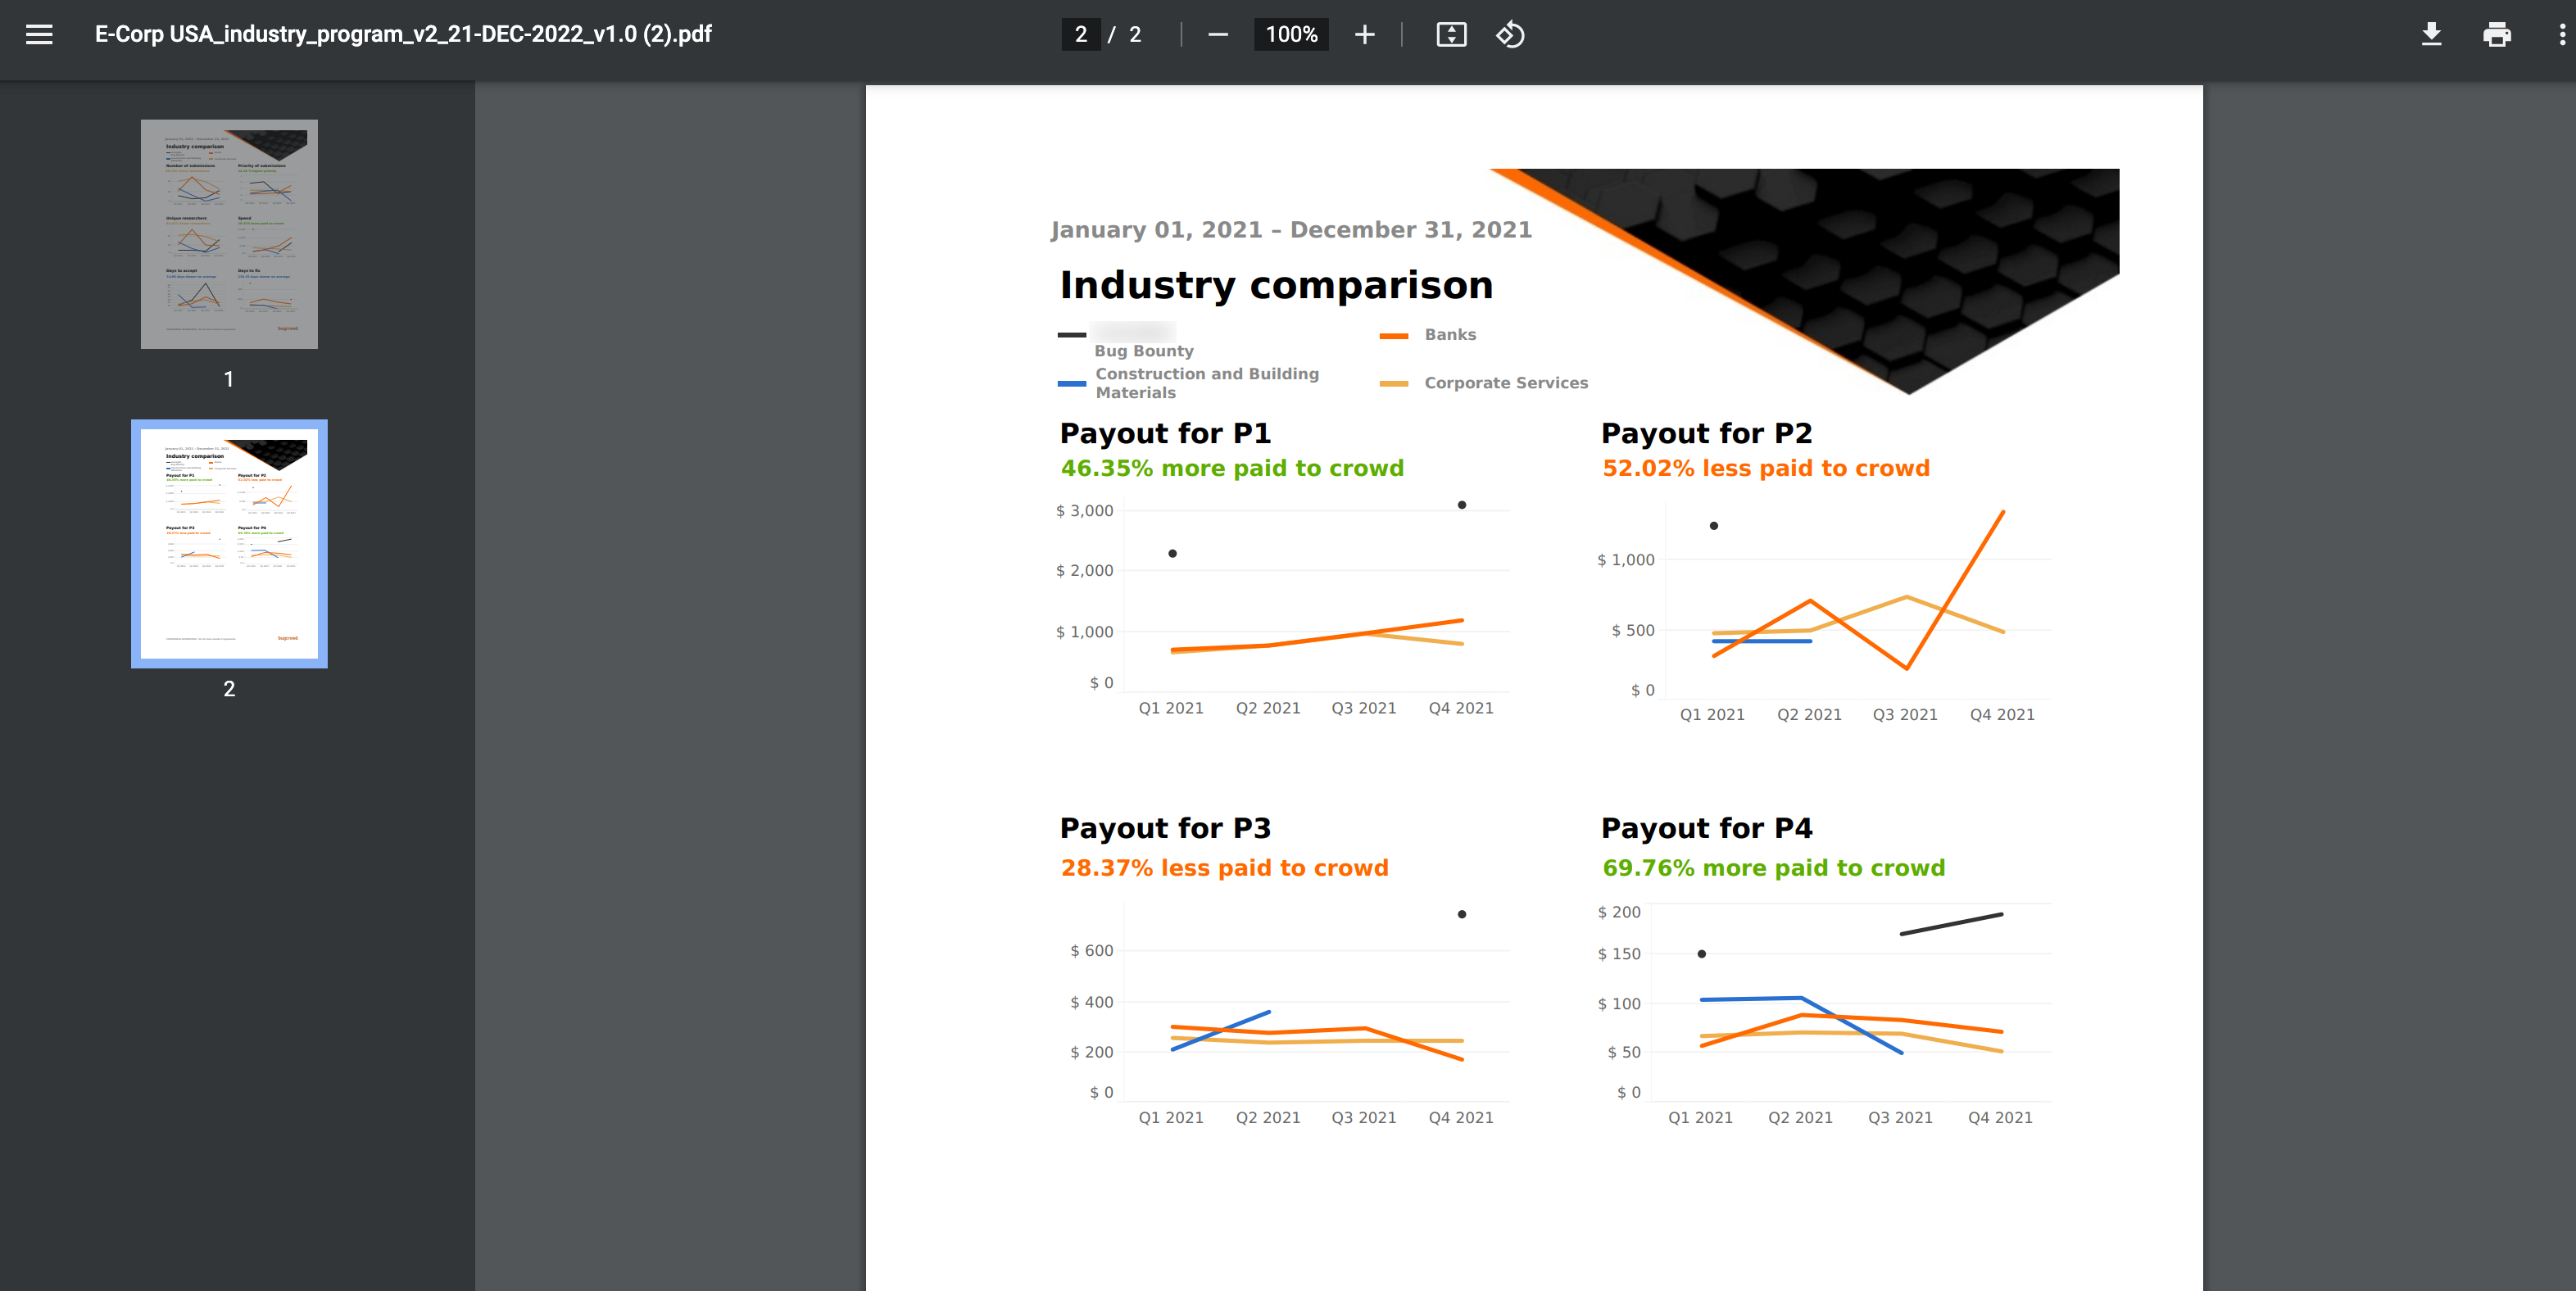
Reading the Industry Comparison Report
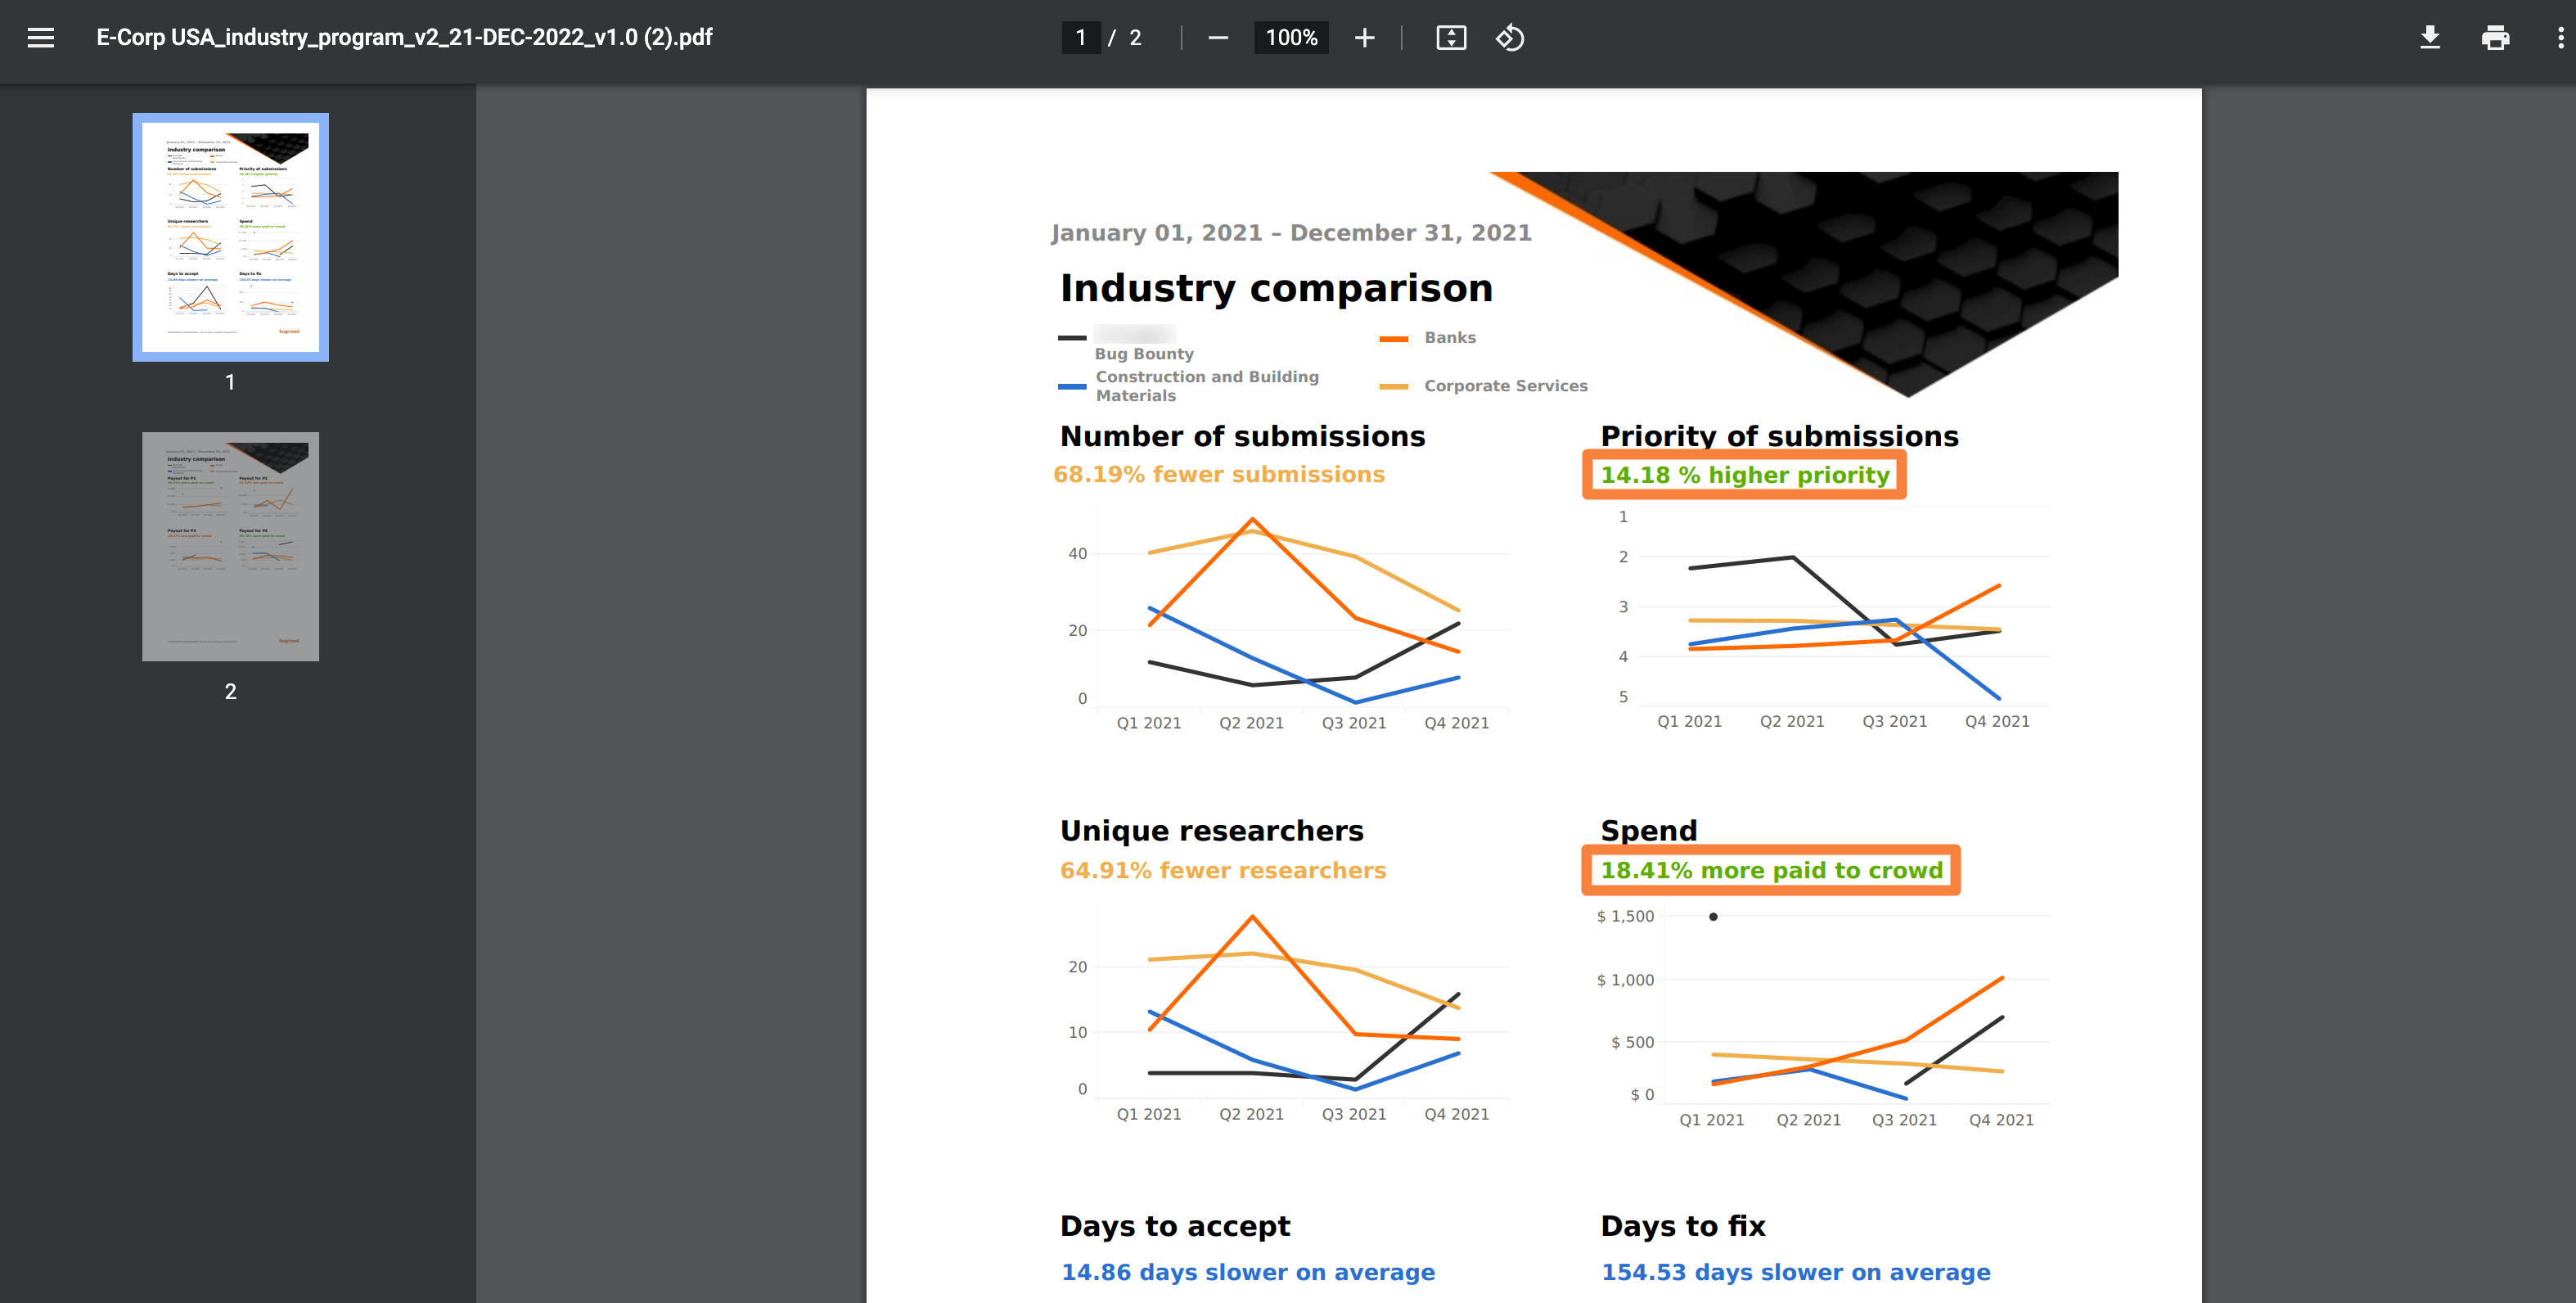
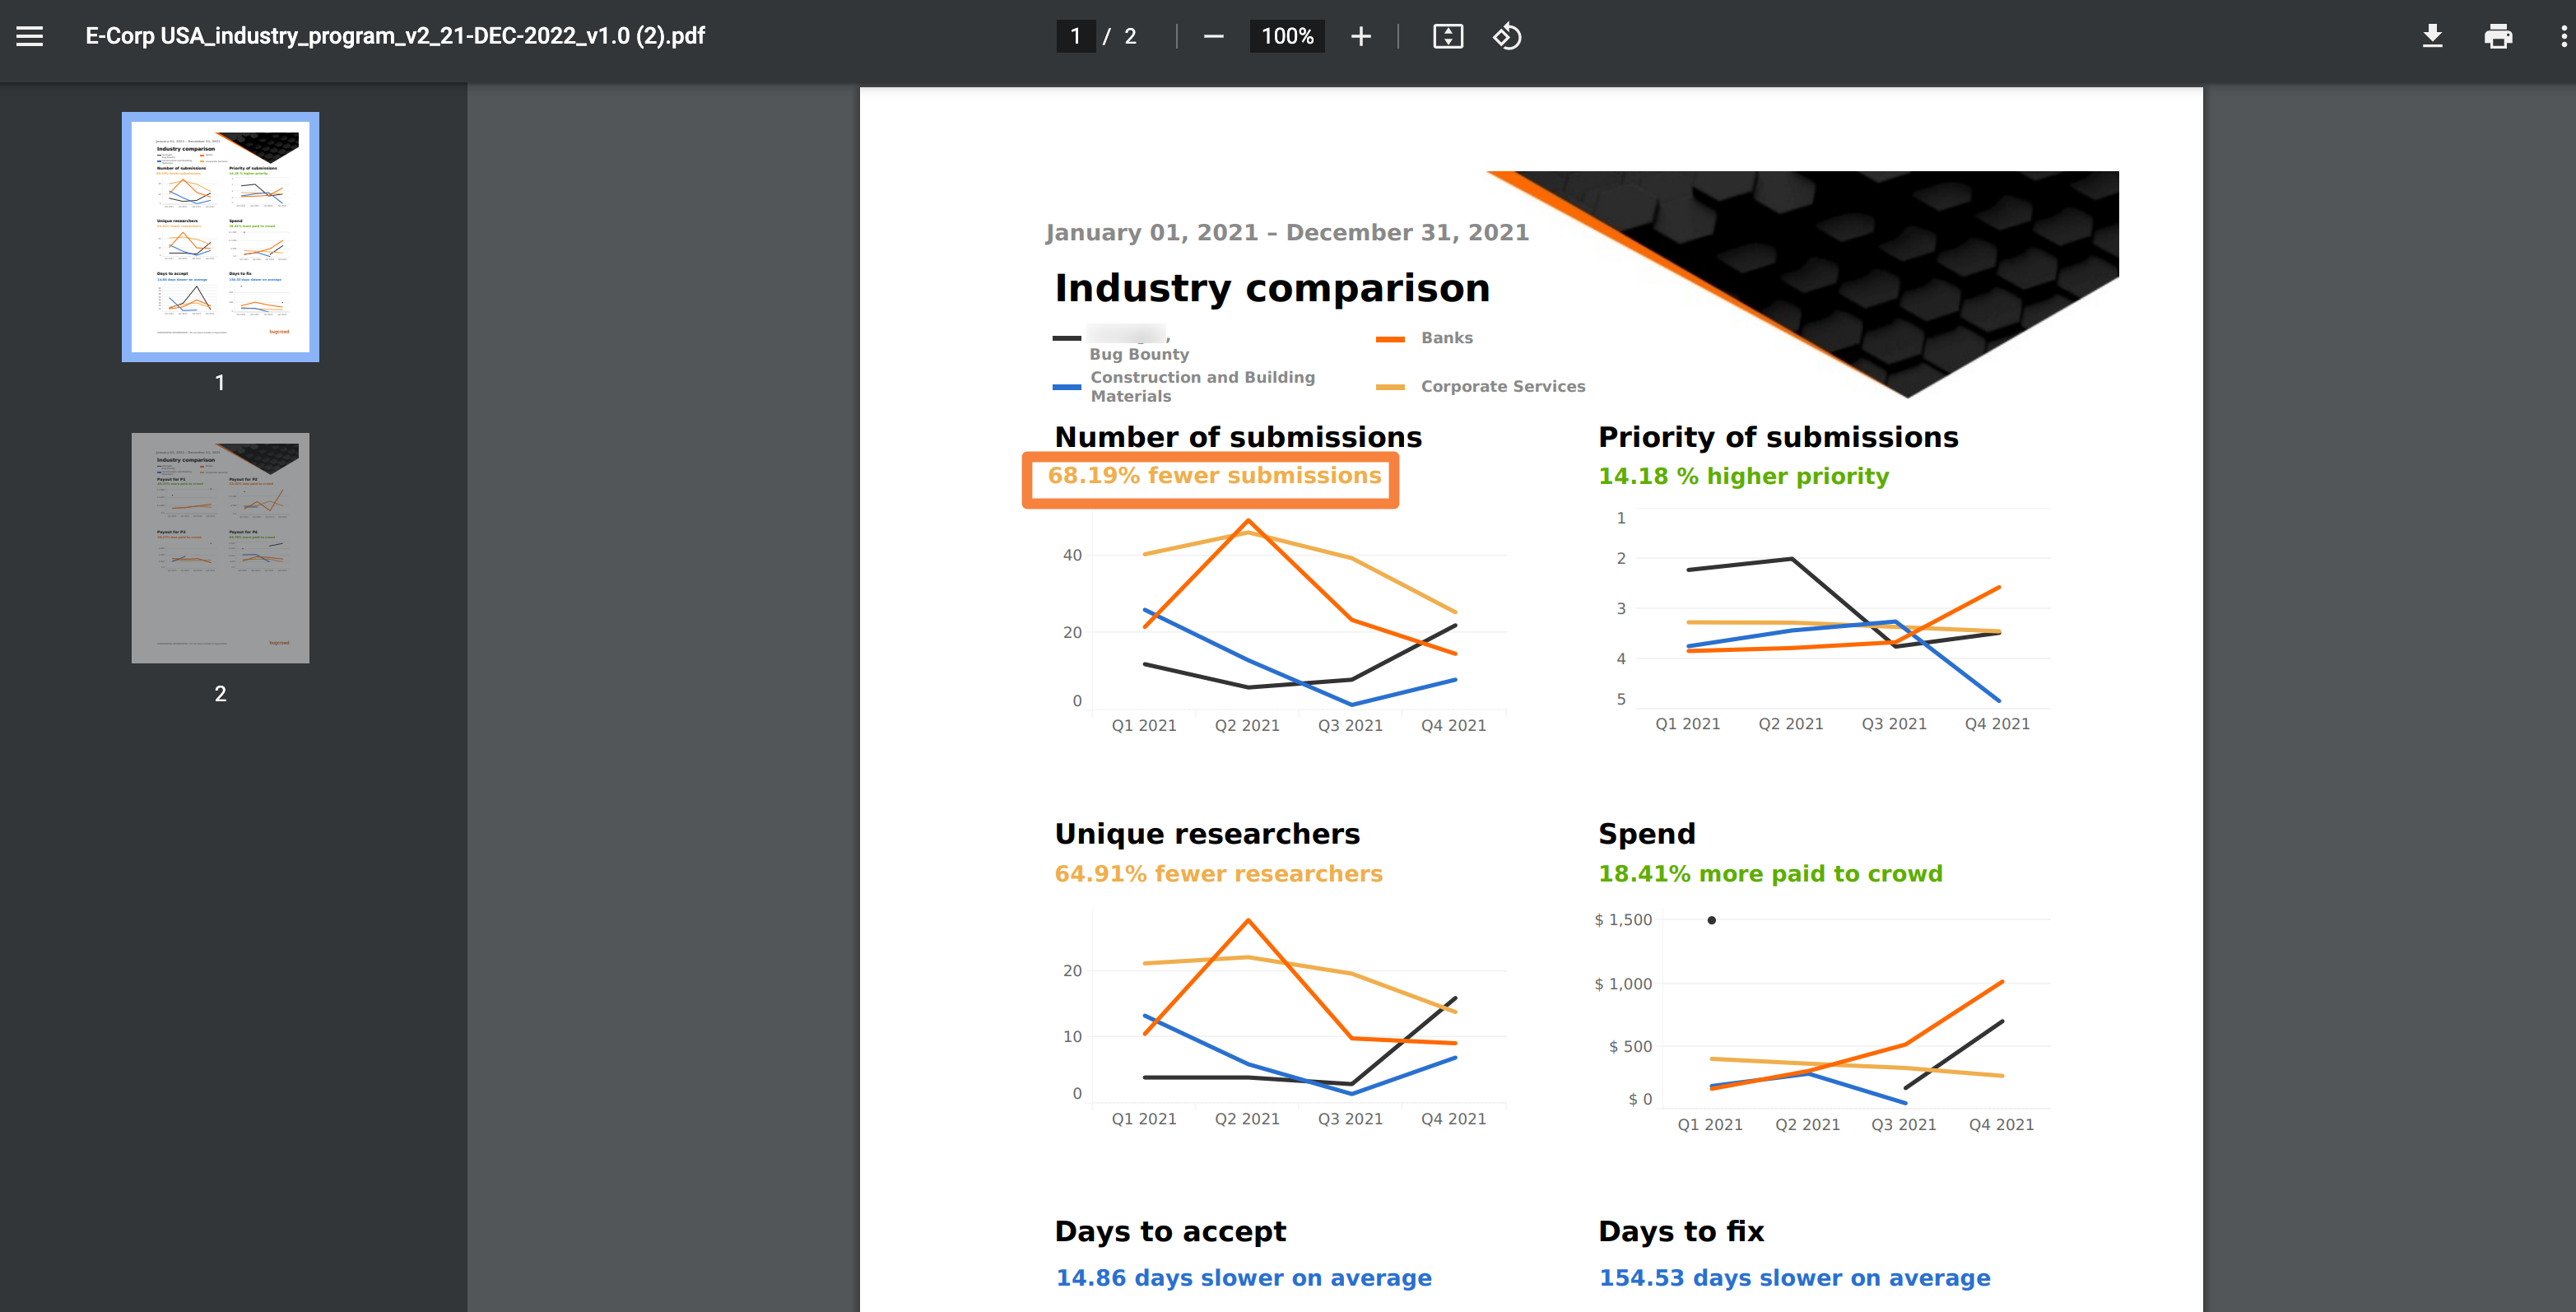
Consider the following while reading the reports:
-
The best performing industry among the three industries you have selected is compared to the Bugcrowd program or engagement. The percentage is displayed accordingly.
-
If the Bugcrowd program or engagement performs better than the remaining industries, the percentage text is displayed in green.
-
If any other industry’s program performs better than Bugcrowd, the percentage text is displayed in that industry’s color.
-
The Spend chart is further interpreted by priority and can be seen in the pay by priority section of the generated report.