Viewing Insights
To navigate to the Insights dashboard, click on the Insights tab.
Insights provides in depth analysis across various metrics to assess your Security Program. Tokenized search can be used to filter the metrics to view more granular data.
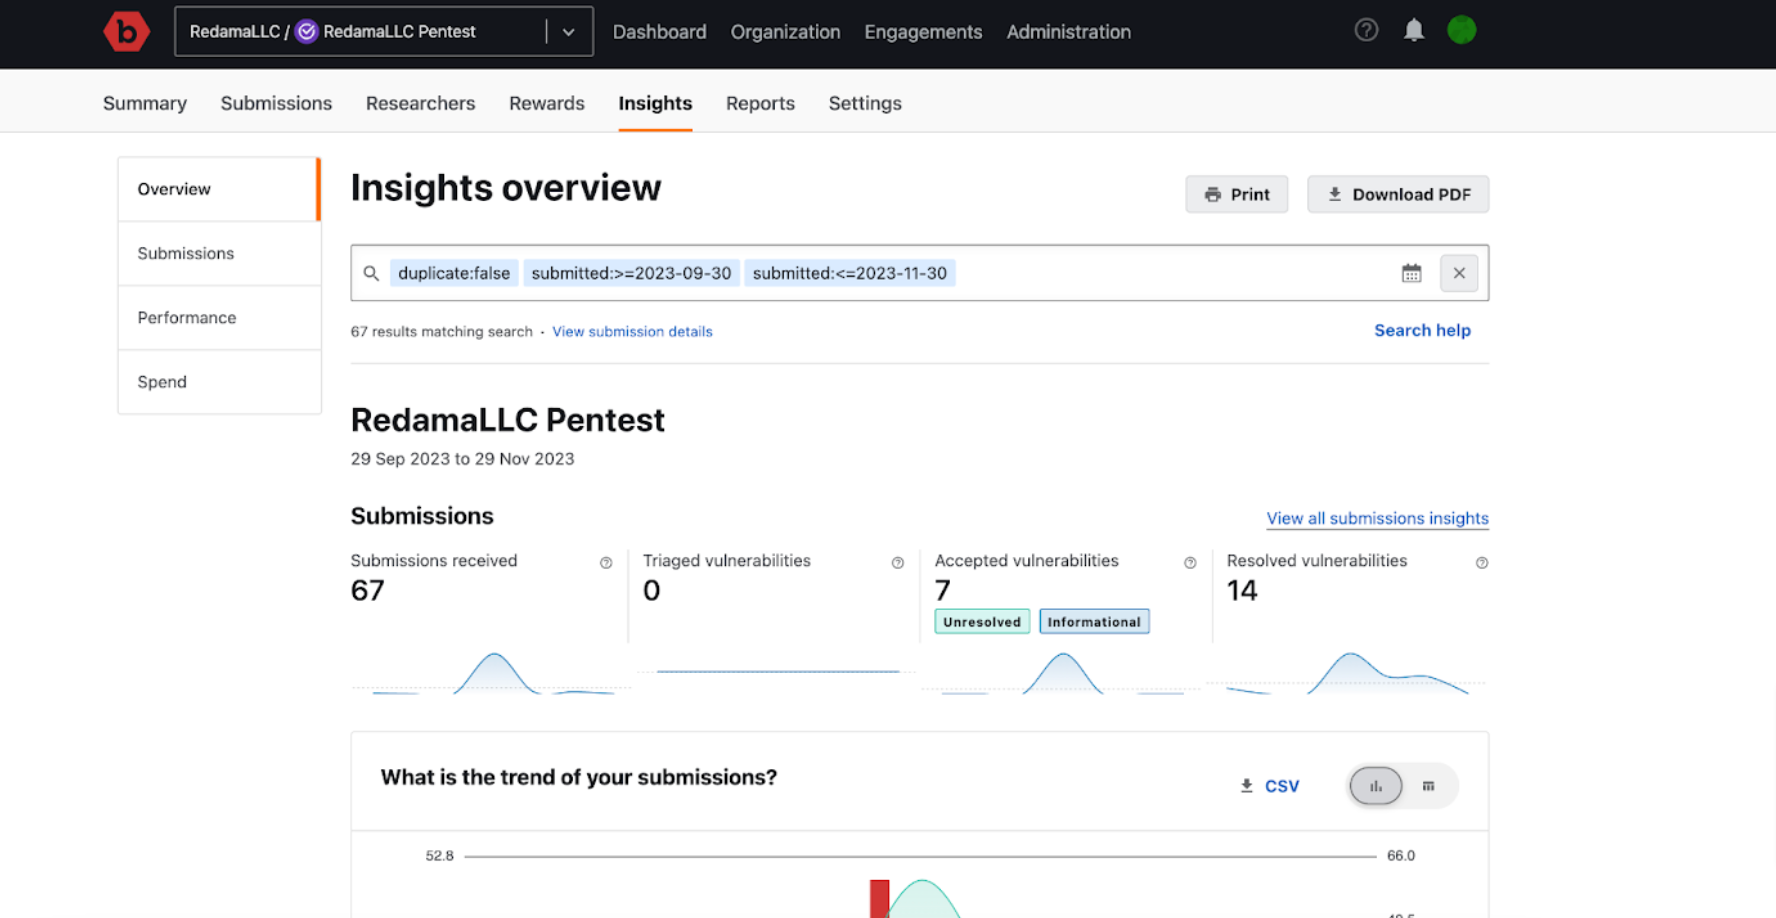
Insights is comprised of four sections:
- Overview: The Overview section provides a summary for all the three subsequent sections.
- Submissions: The Submissions section provides detailed insights on the submission received in your program.
- Performance: The Performance section provides a snapshot of your program efficiency rating.
- Spend: The Spend section section a provides snapshot of the amount (in dollars) spent at any point of time on your program.
Insights Overview will provide you links directly to the subsequent sections for more in depth metrics.
Filtering Insights
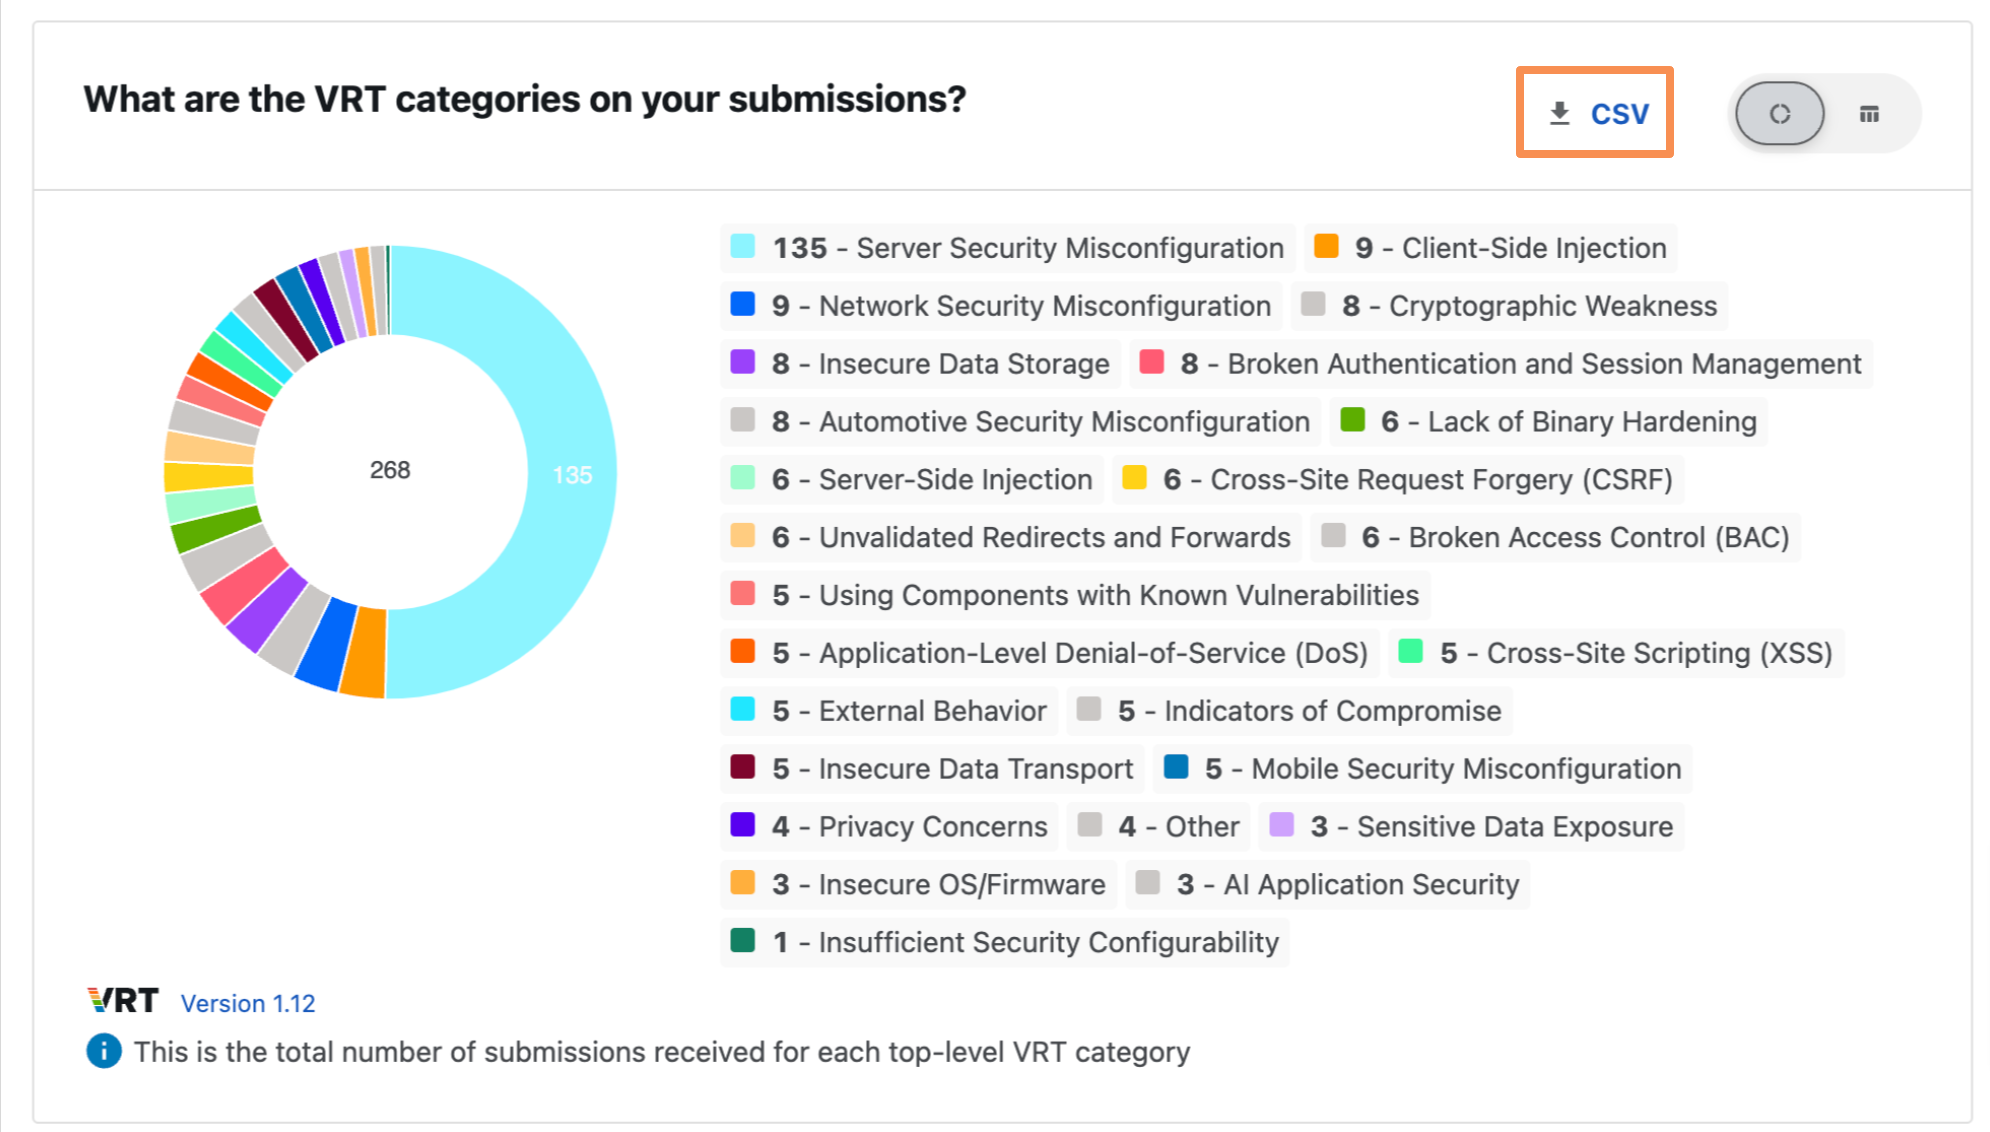
Provide appropriate filters in the search bar to view relevant insights about your program and engagements.
Click on View submission details to confirm that the filter criteria provides the submissions relevant to your query.
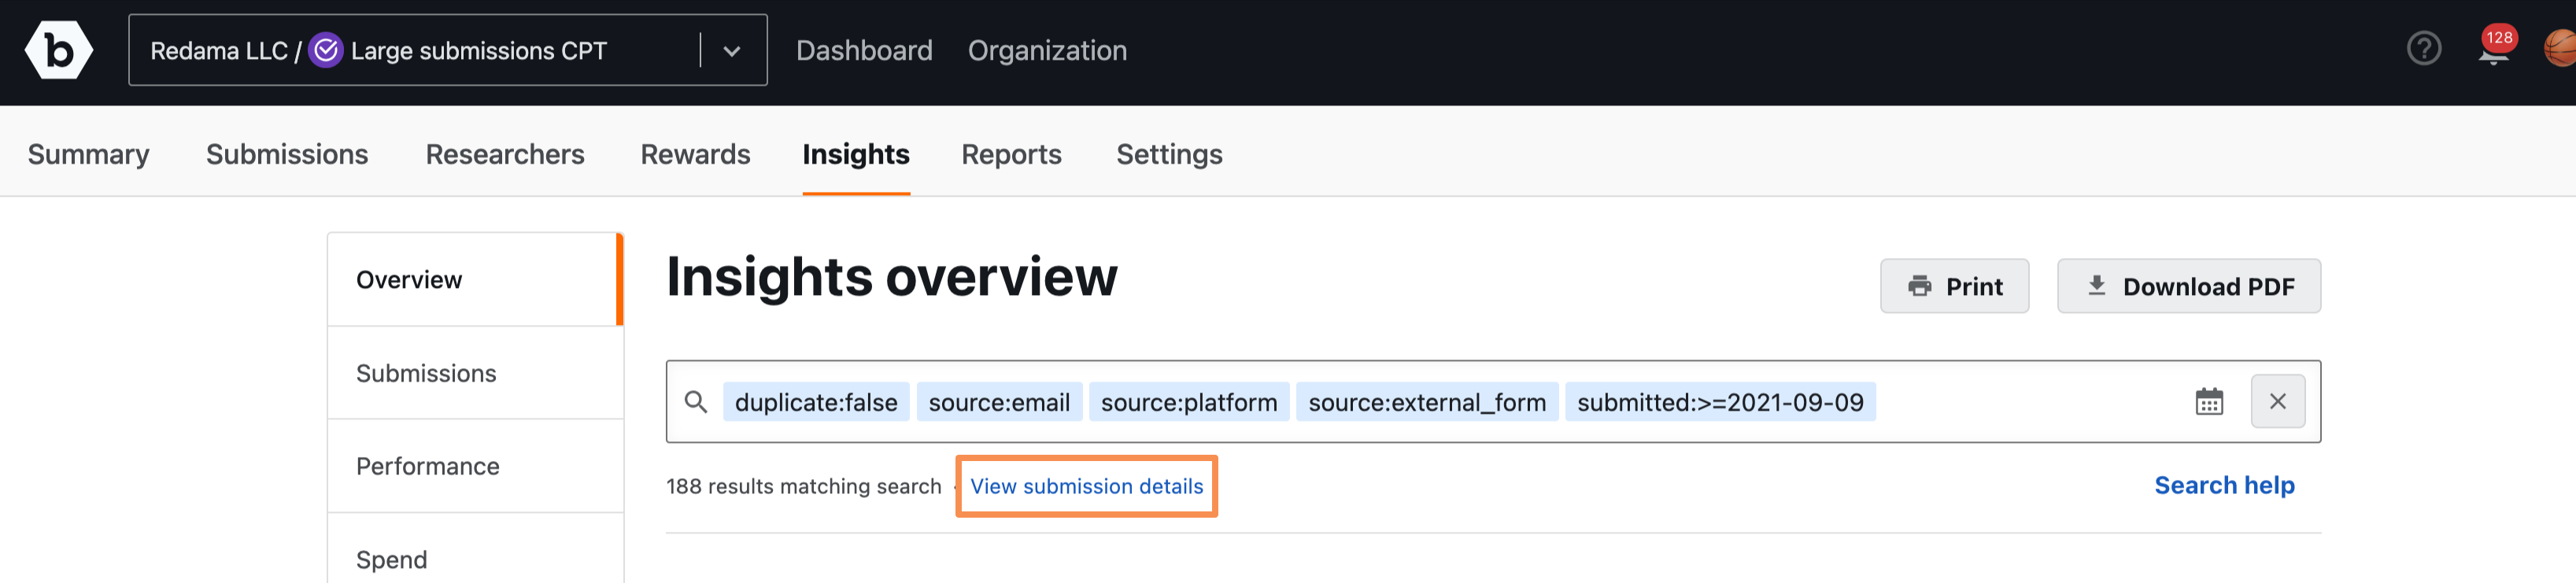
Downloading the Insights Report
To download a CSV version of a table, click on the CSV button. This will download the table in the form of a CSV.
Usage Tip
- The new Insights metrics are only available for Organizations that have migrated to the Security Program Management (SPM) model.
- You can hover over a graph to see data points along the plots.
- For time period, the user’s timezone is used. However, if the user’s timezone is not available, then UTC timezone is used.
- For metric definitions, please reference metric glossary.
- To toggle between a graph and table view, use the Table Switcher buttons located on the top right corner of a graph. If the buttons are not available, then there is only one view for that specific graph.