All team roles can access the Rewards page.

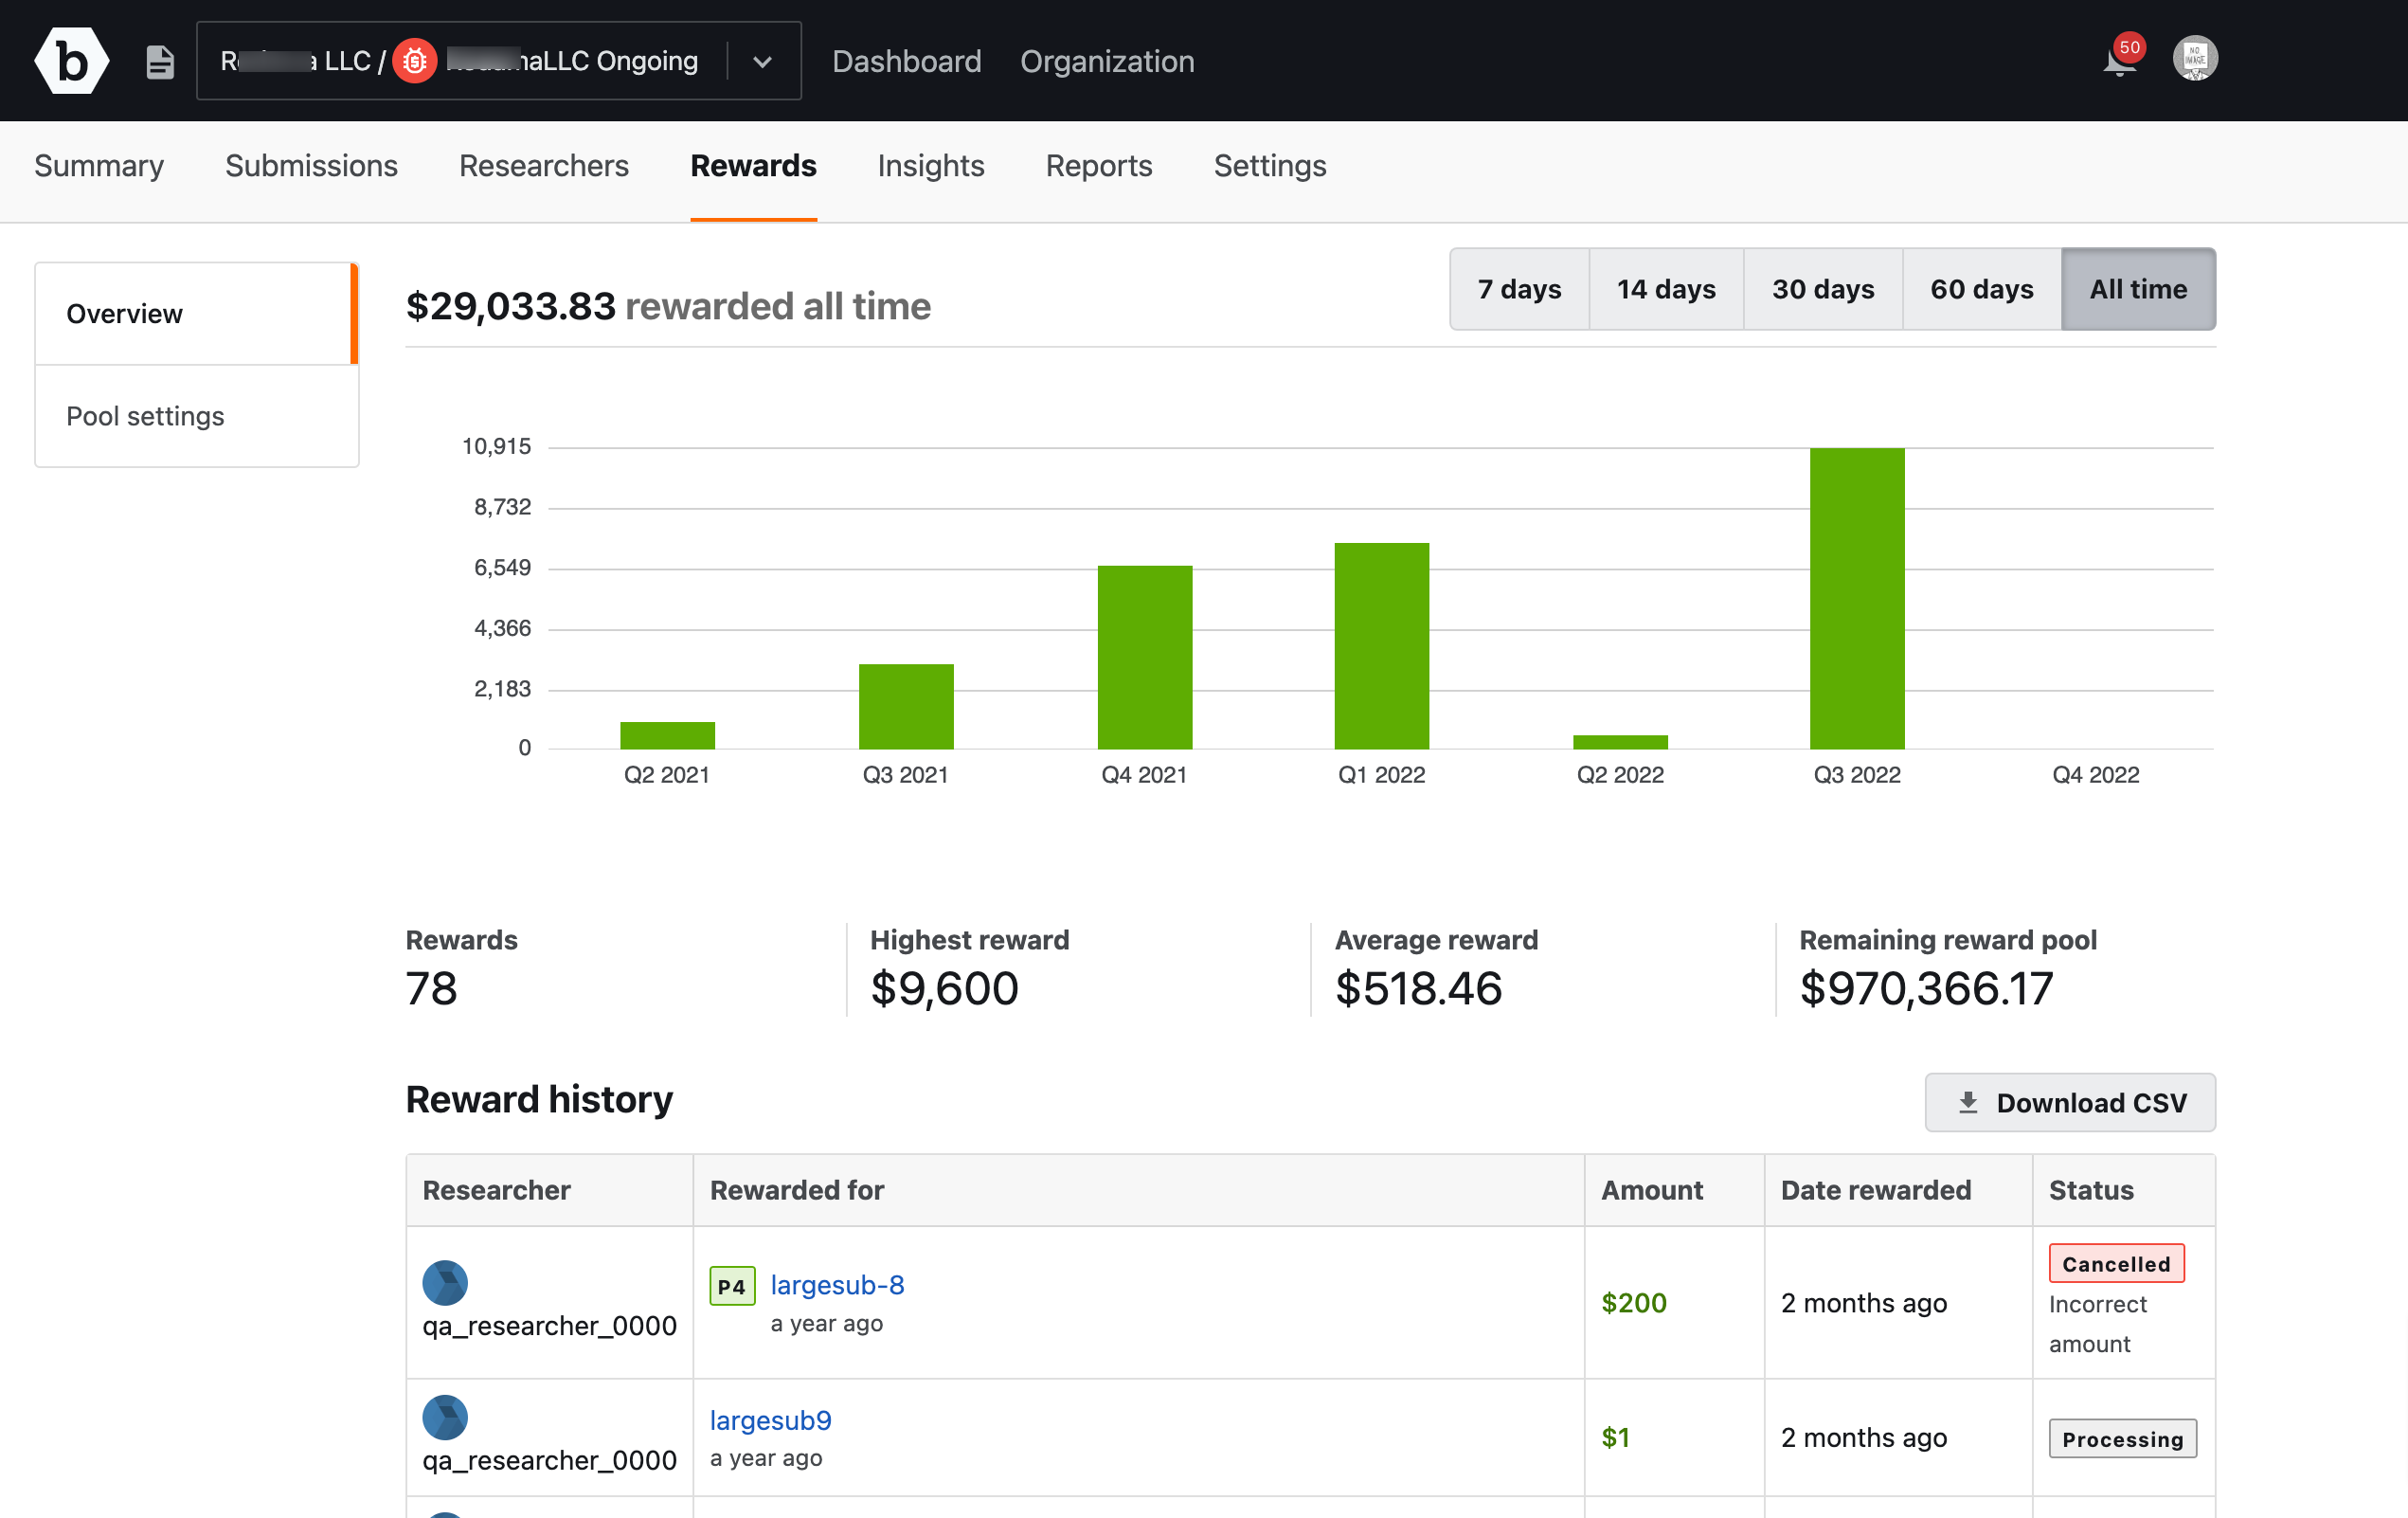
From the Rewards Page, you can do the following things:
- Graph the payment data over a period of time.
- View the total number of rewards paid out by the program.
- View the highest reward amount that has been paid to a researcher.
- Identify the average reward amount.
- Find out how much money you have left in the bounty program.
- View a list of researchers who have received a reward.
- Filter the data in the graph to show payment trends over 7 days, 14 days, 30 days, and all time.
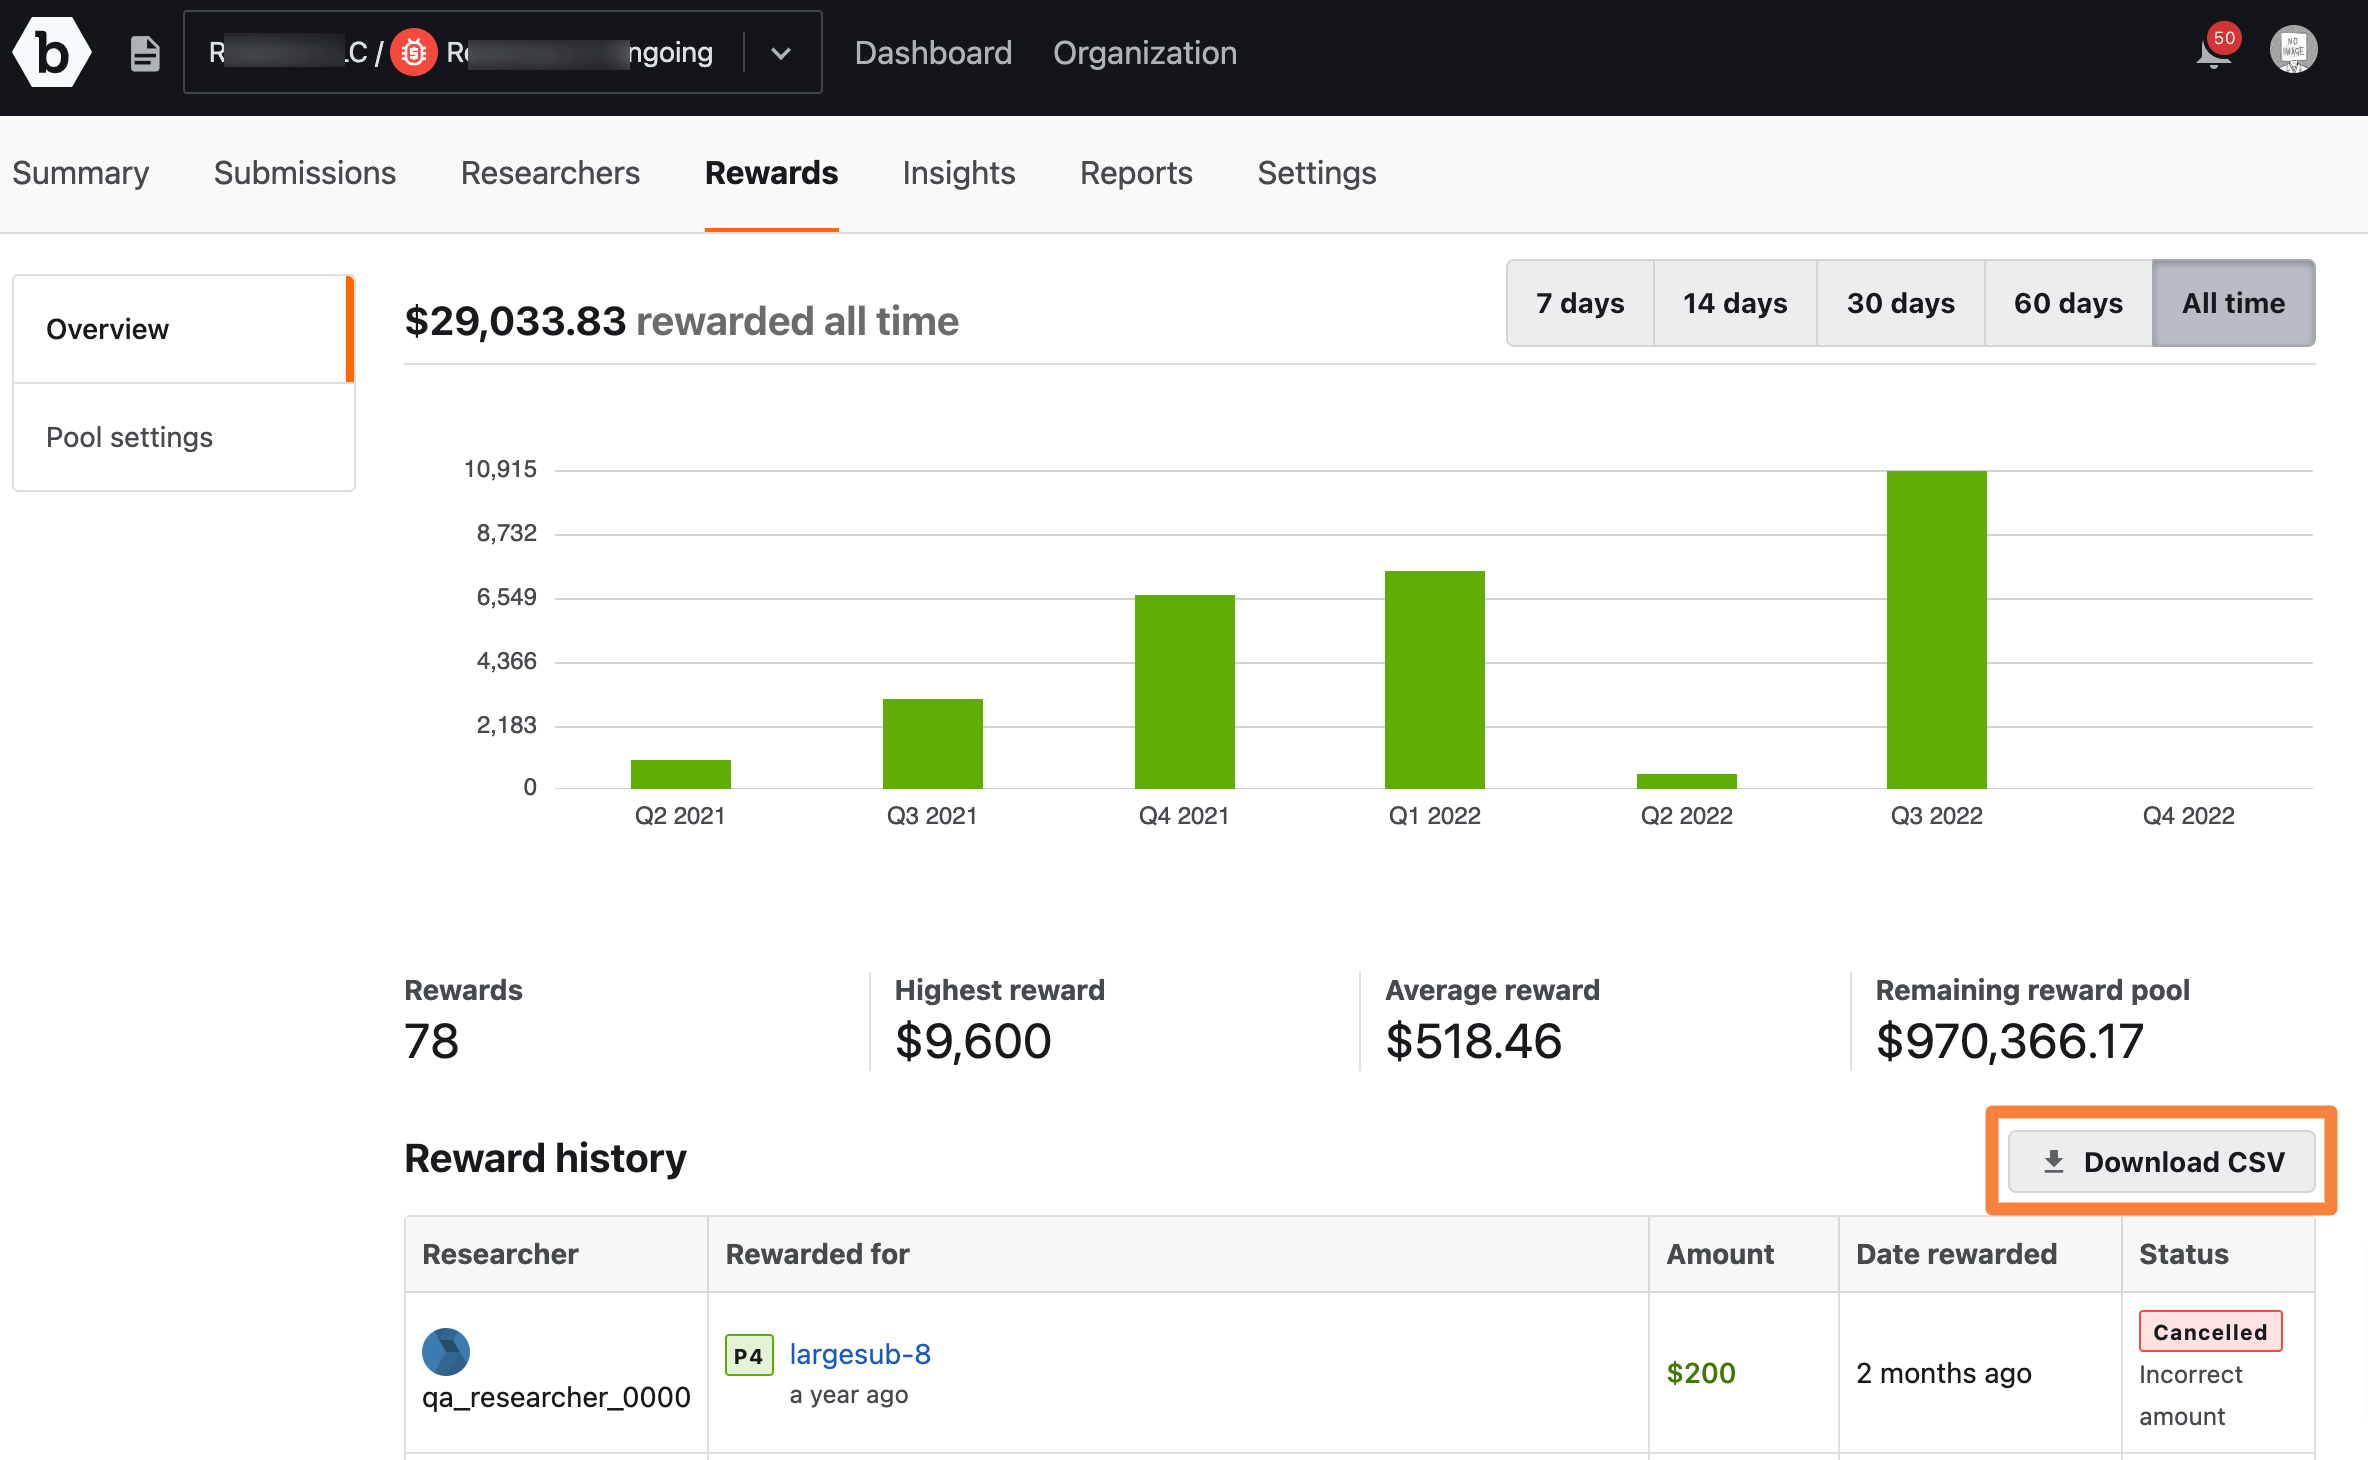
- Export the data in the “Rewards History” table as a CSV file.
The Payment Graph
The Payout graph lets you view the total amount of payouts over a period of 7 days, 14 days, 30 days, 60 days or all time. You can use the filters control the scope of data in the graph.

Program Payout Stats
You can view the payout stats to determine the highest amount that has been paid to a submission, the average payout amount, and the total amount of money left in the bounty program.

The Average Reward statistic does not include any tips paid to a researcher. A tip is not included as part of a standard payout if:
- They are paid out in a points-only program.
- They are paid out on top of a reward that has already been paid.
- They are paid out on submissions that have been rejected because they are duplicates or not applicable.
- They are paid out on submissions that do not have a suggested reward amount, such as submissions that are P5.
The Reward History
The Reward History displays all submissions that you have rewarded for the program.

To learn more about researchers earning on your program, their profiles are linked if public.
Exporting a CSV of Rewards Data
To export a CSV of the information in your Reward History table, click Download CSV.

The exported data will include:
- The reference number associated with a bug report
- The amount that was paid to the researcher
- The title of the bug report
- The date and time the bug was submitted
- The researcher who submitted the report
