- Timeline View Of Submissions Received Based On Severity
- Timeline View Of Total Submissions Received Over Time
- Total Submissions Received
- Open Vulnerabilities
- Fixed Vulnerabilities
- Target Breakdown
- Submission Type and Severity
The Submissions Received section on the Insights dashboard provides a comprehensive understanding of the submission trends in your program. It helps to identify actionable submissions that are currently in the open state.
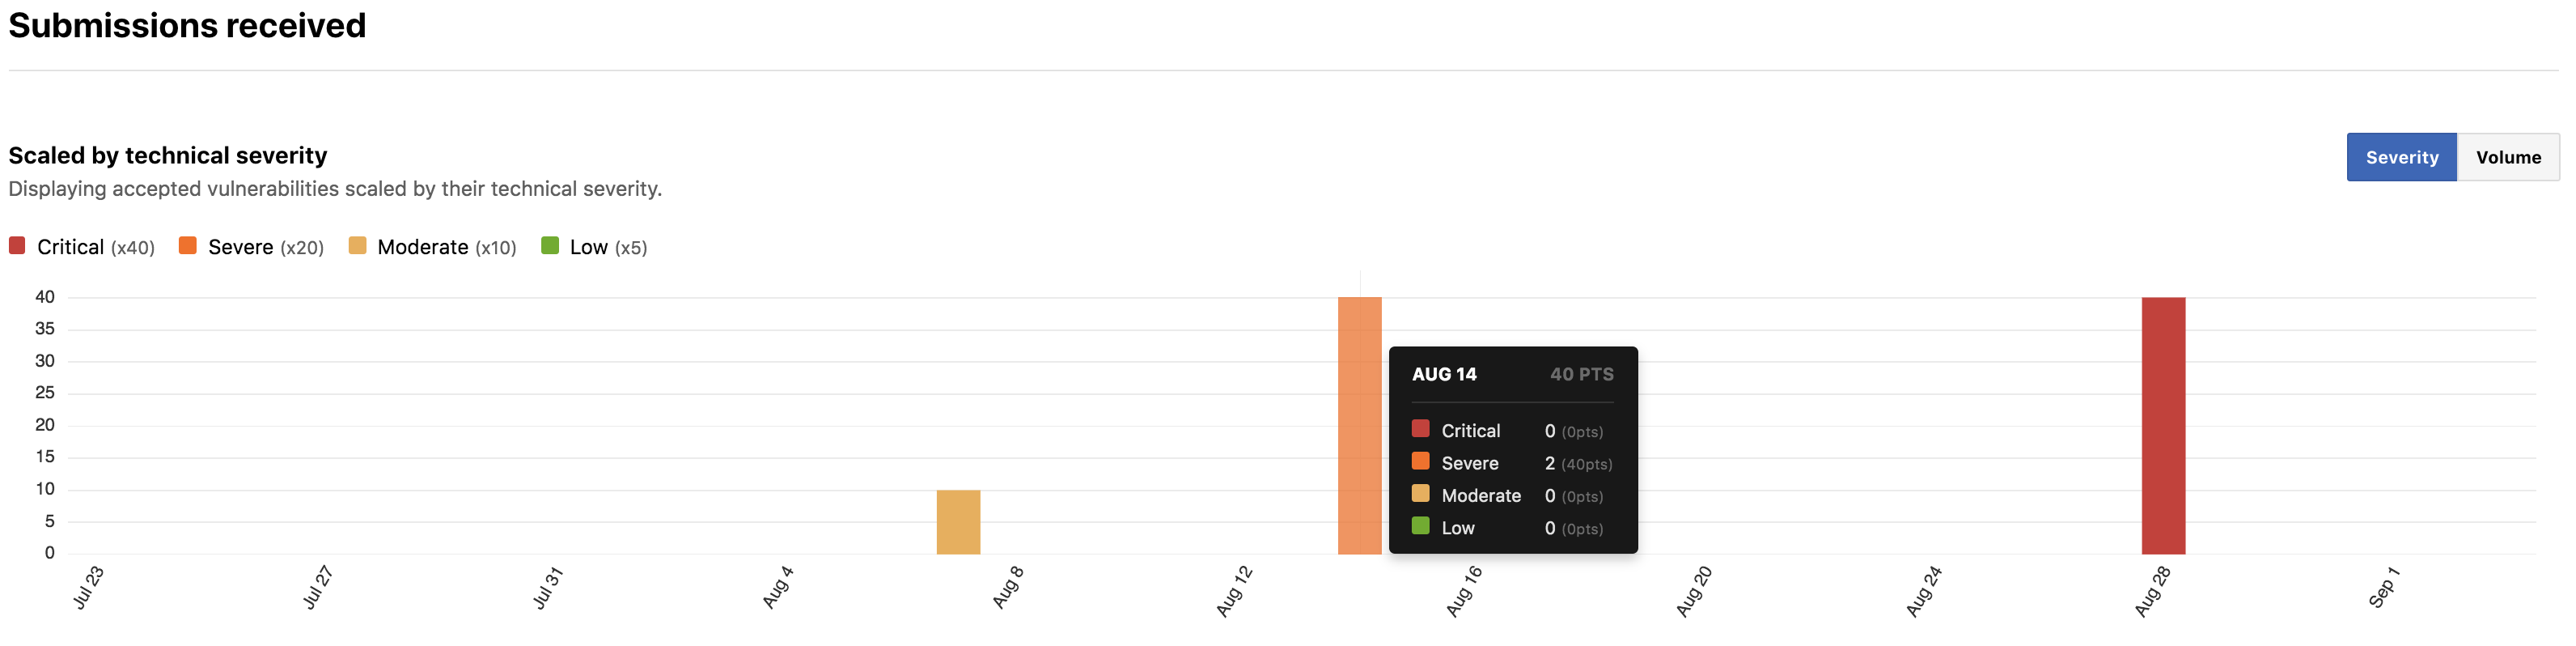
Timeline View Of Submissions Received Based On Severity
The Submissions received section provides a timeline view (impact levels) of valid submissions received based on technical severity.
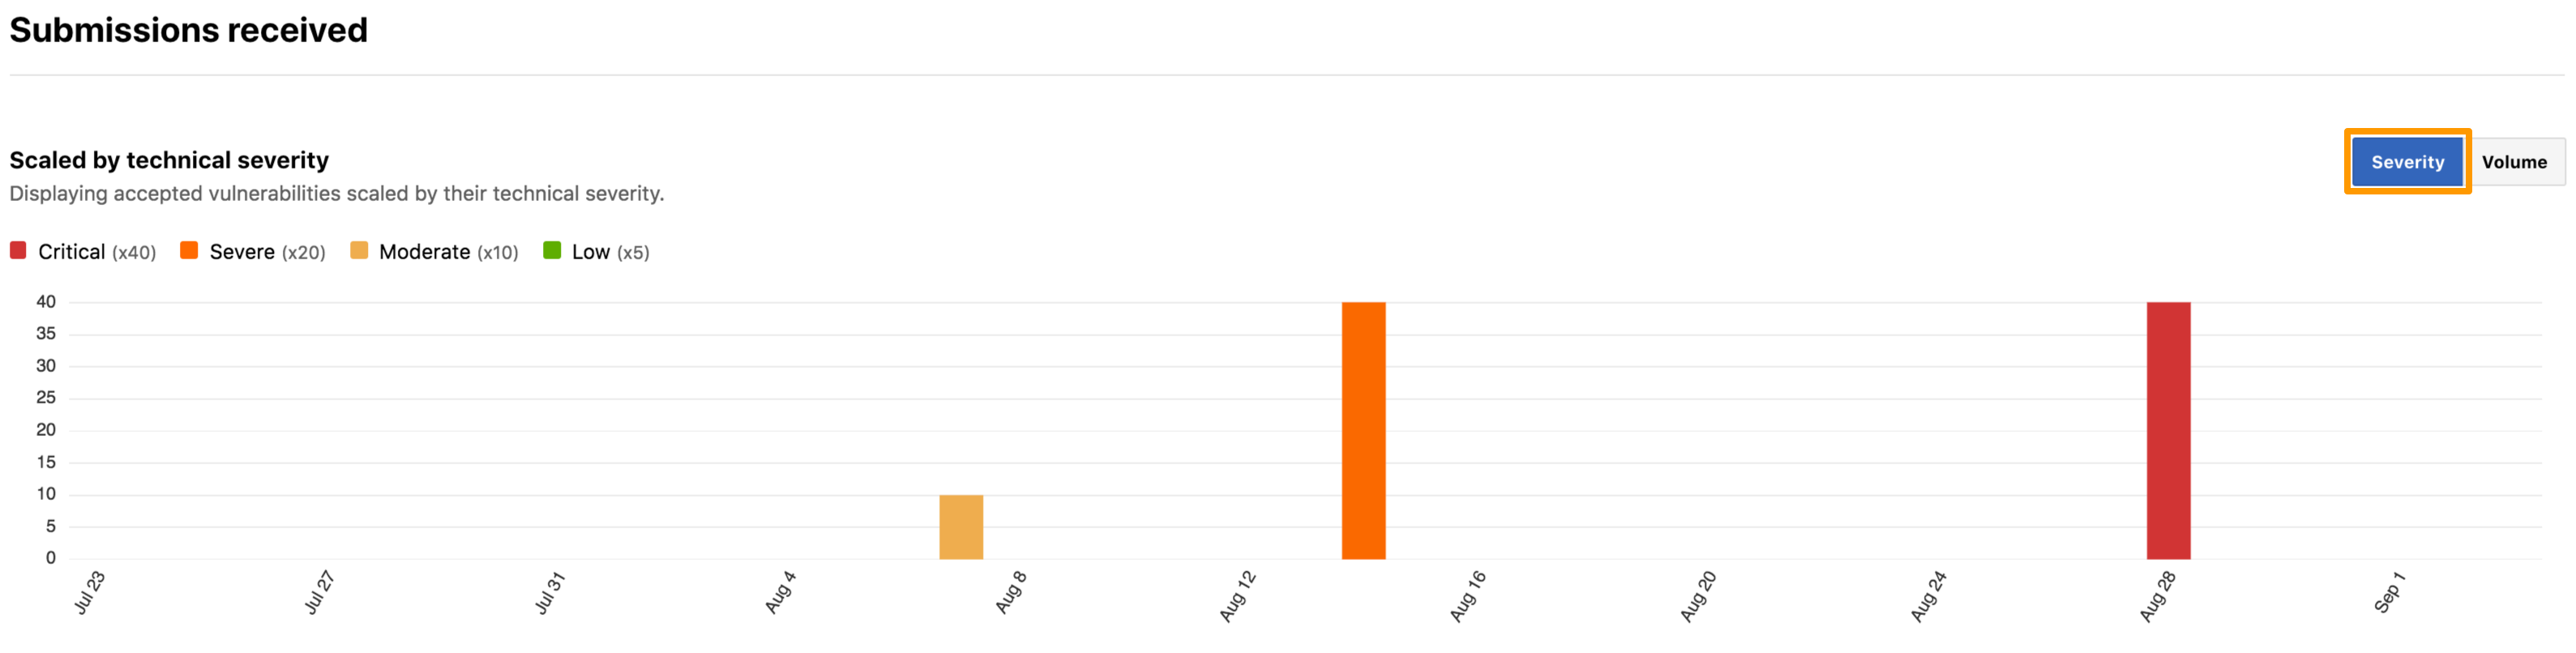
Hover over a single column on the graph to view the number of valid submissions for a specific time period.
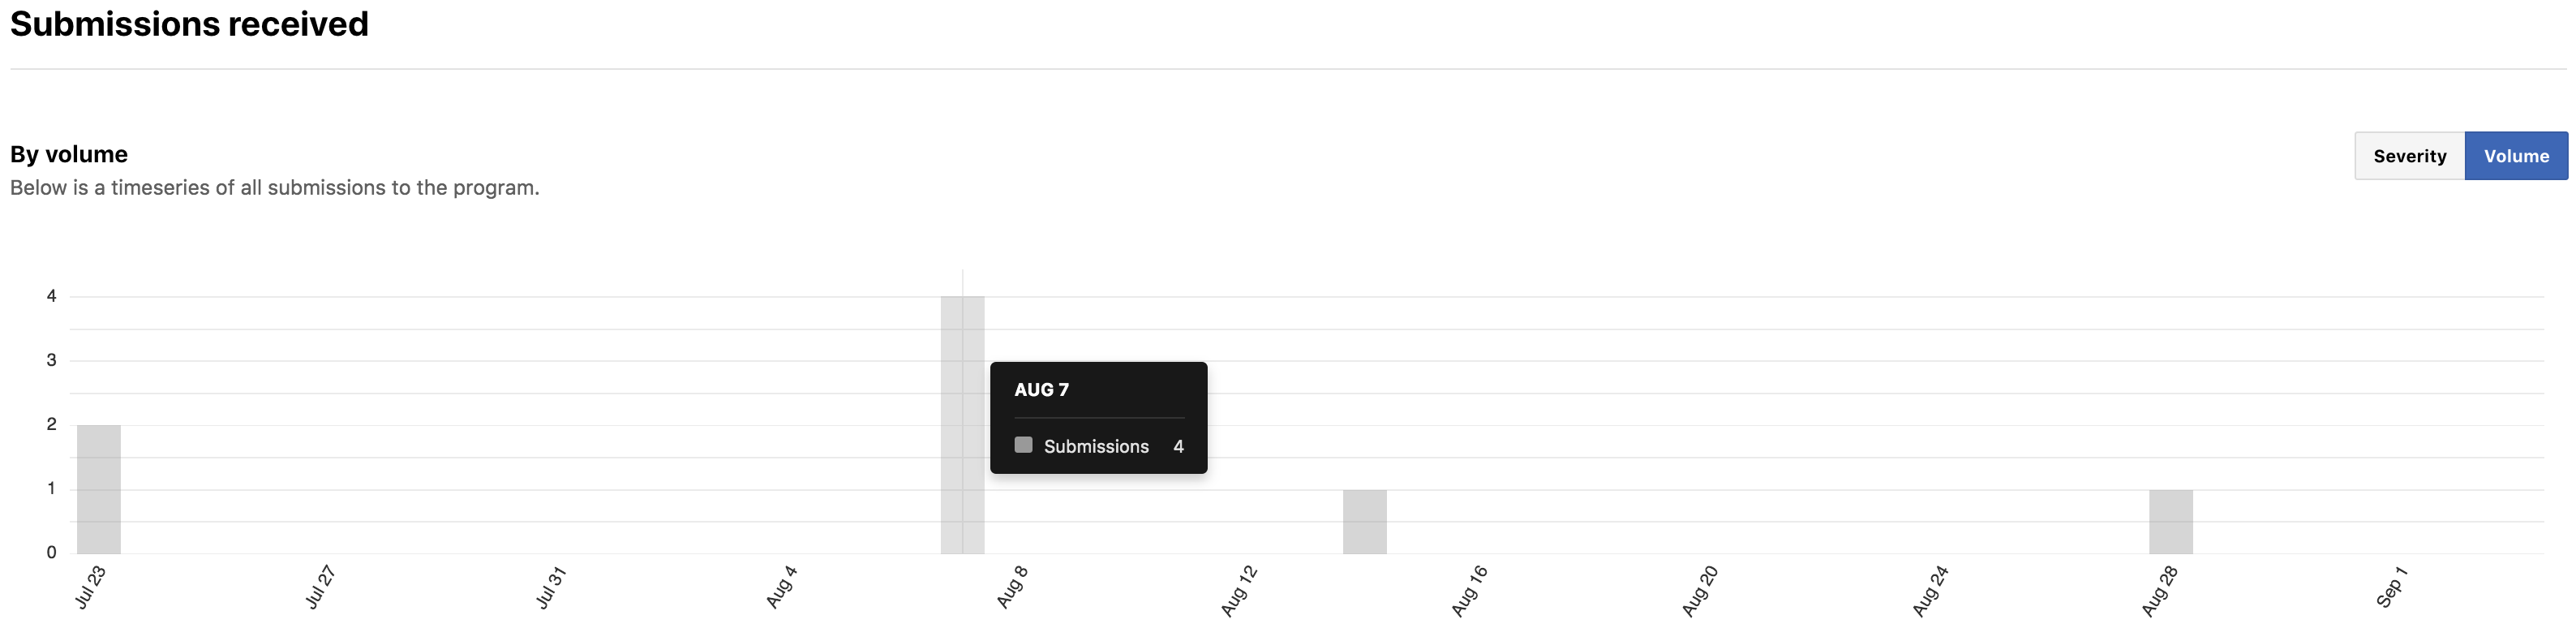
Timeline View Of Total Submissions Received Over Time
In the Submissions Received section, click Volume to view the total number of submissions received for a given time period for a program. You can identify trends and spikes in submissions associated with program adjustments such as new code releases, broadening the scope, increasing the reward range, PR announcements, or incentive programs.
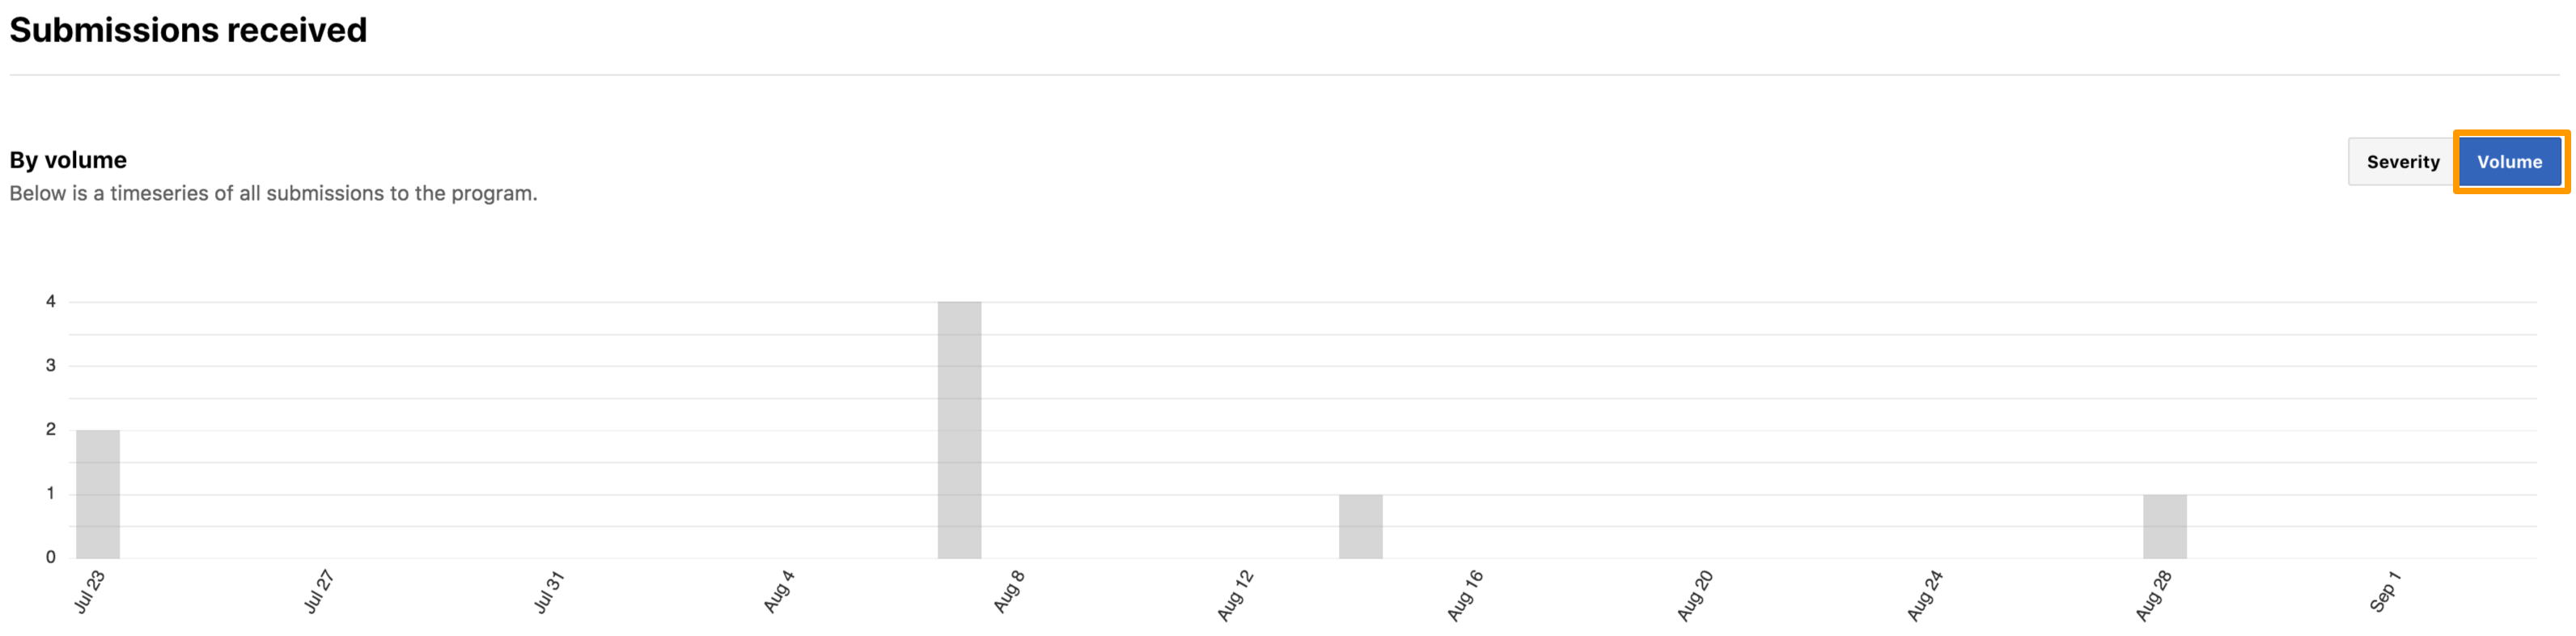
Hover over a single column on the graph to view the total number of submissions for the specific period.
Bugcrowd Account Manager Guidance: Bugcrowd Account Managers provide guidance to help organizations run a healthy and effective bounty program. Contact your assigned account manager or submit a support ticket through Bugcrowd Support Portal to collaborate with an expert and discuss strategies to help improve and maintain a healthy program
Total Submissions Received
Submissions received represents the total number of submissions your program has received for a given time period. It includes valid and non-valid (informational, out of scope, not reproducible, and not applicable) submissions. However, it does not include duplicate submissions.

Open Vulnerabilities
Open vulnerabilities represent the total number of vulnerabilities in the Open state from the filtered time period. These are actionable submissions in the Triaged or Unresolved state that must be addressed by your team. Quickly addressing these submissions will improve your program performance.

Fixed Vulnerabilities
Fixed vulnerabilities represent the total number of vulnerabilities fixed from the filtered time period.

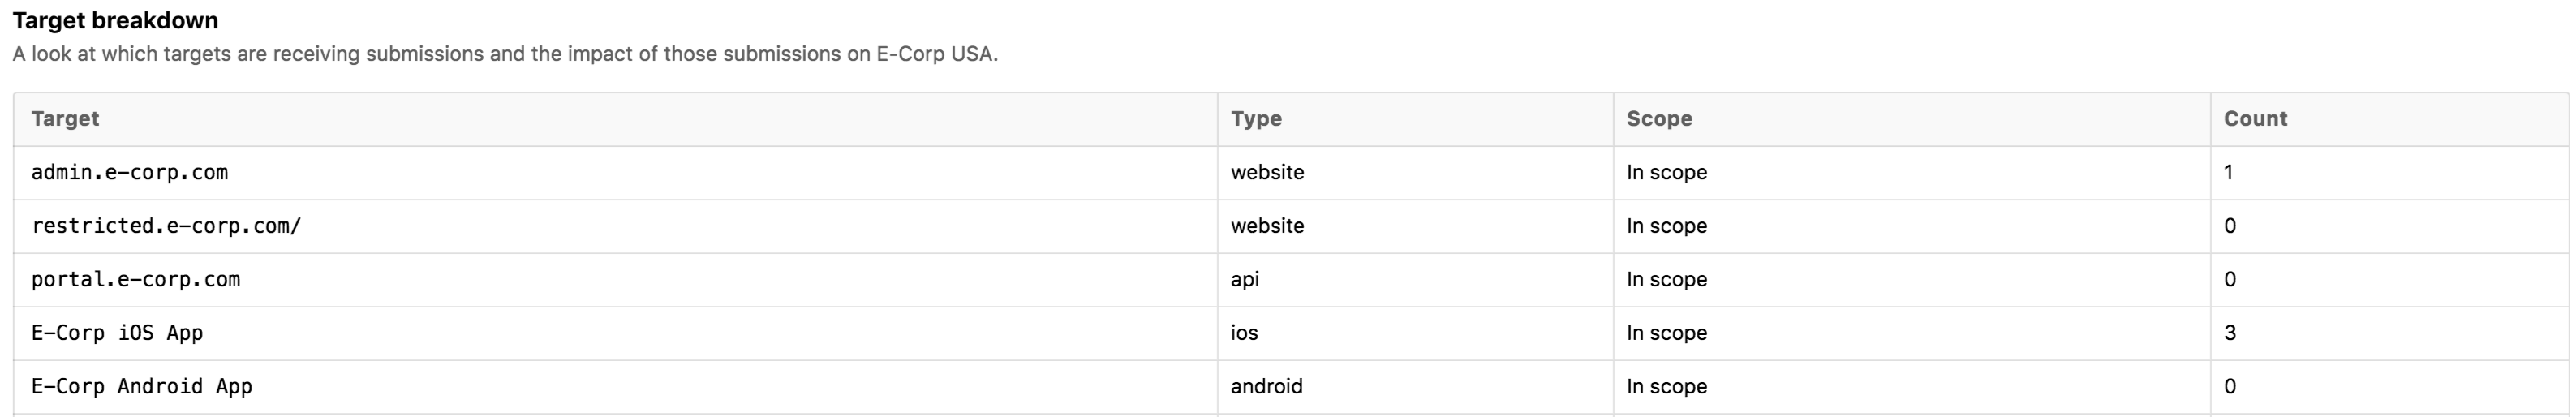
Target Breakdown
The Target breakdown section provides a snapshot view of the total number of submissions received on a target over a specific time period. You can identify targets that:
- Receive the highest and lowest number of vulnerabilities
- Are most and least secure
Submission Type and Severity
The Submission type and severity section provides a view of the total number of valid vulnerabilities submitted for your program based on the vulnerability type. These vulnerability types represent the top level categories based on Vulnerability Rating Taxonomy (VRT). The table lists the most common vulnerabilities found in your targets. You can send this information to your development team for improving the application security.
The Technical severity graph provides a view of the most common submissions received by technical severity over a specific period of time.
