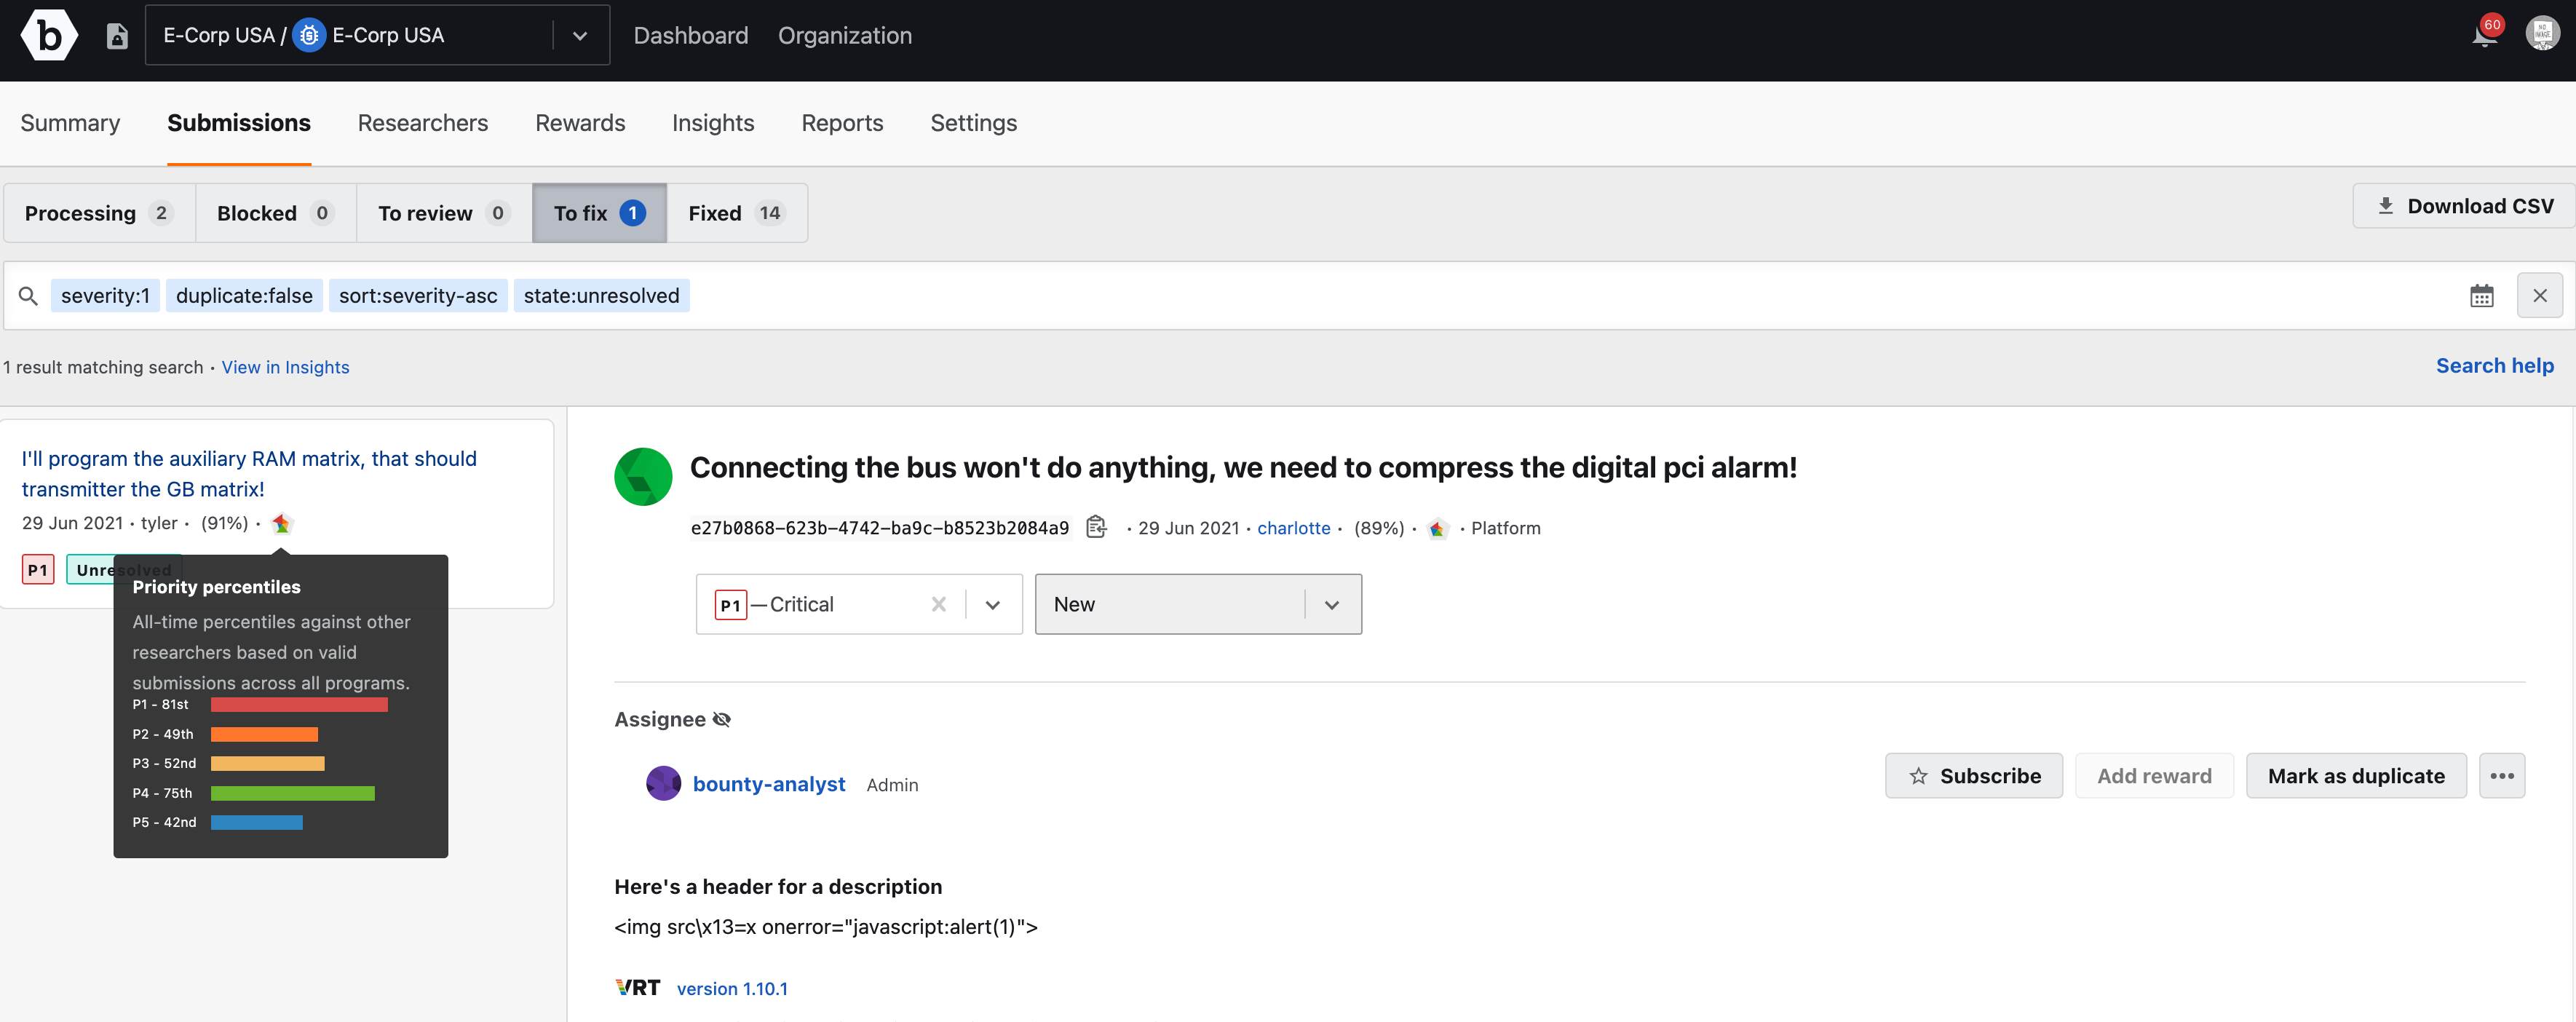
To view the priority percentile, in a submission, hover over the pentagon icon. The all time percentile icon is available in two locations as shown.

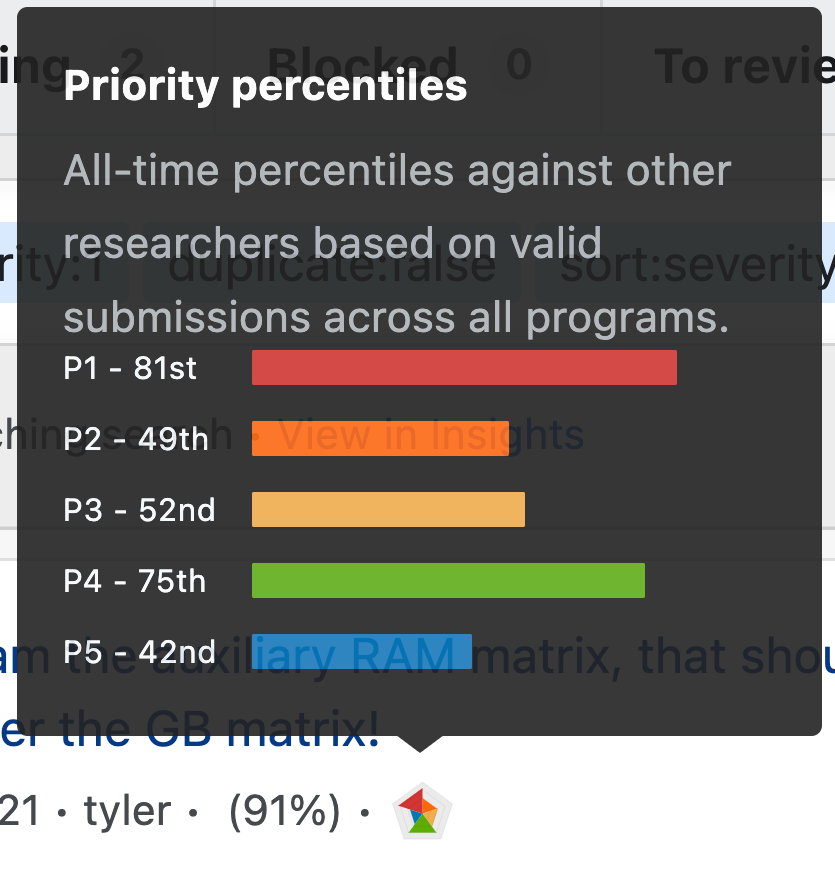
When you hover over the pentagon icon, a bar graph will appear displaying the researcher’s priority percentile that includes the following:
- All five priority levels, displayed as different colors: P1, P2, P3, P4, and P5
- Displays the percentile level in relation to all researchers. The size of the bar and the percentile value indicates the percentile level.
Percentiles are based on all the valid submissions: Won’t Fix, Duplicate, Unresolved, and Resolved.

The following image shows the different colors displayed for different priority levels.

