Insights Overview
The Insights Overview provides a high-level summary of the three main focus areas analyzed to assess your Security Program’s health:
- Submissions
- Performance
- Rewards
The overview also provides links to direct you to the subsequent focus areas for more in-depth analysis of your program health.
Submissions Overview
This section provides a quick view of submission state trends and categories, and targets with the most submissions.
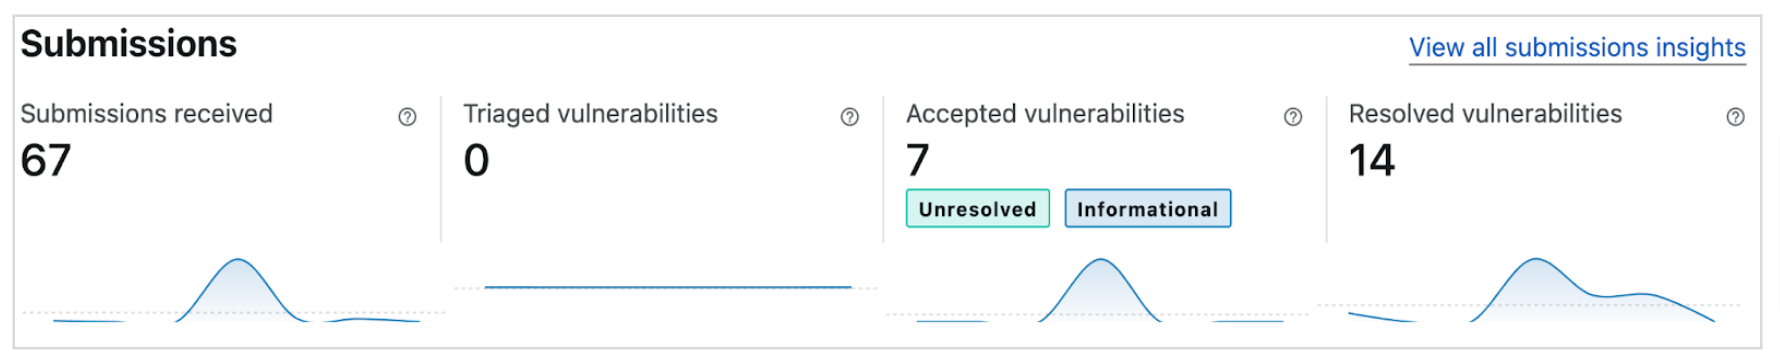
Submission State Statistics and Trends
This is a summary of substate statistics and high-level submission trends.
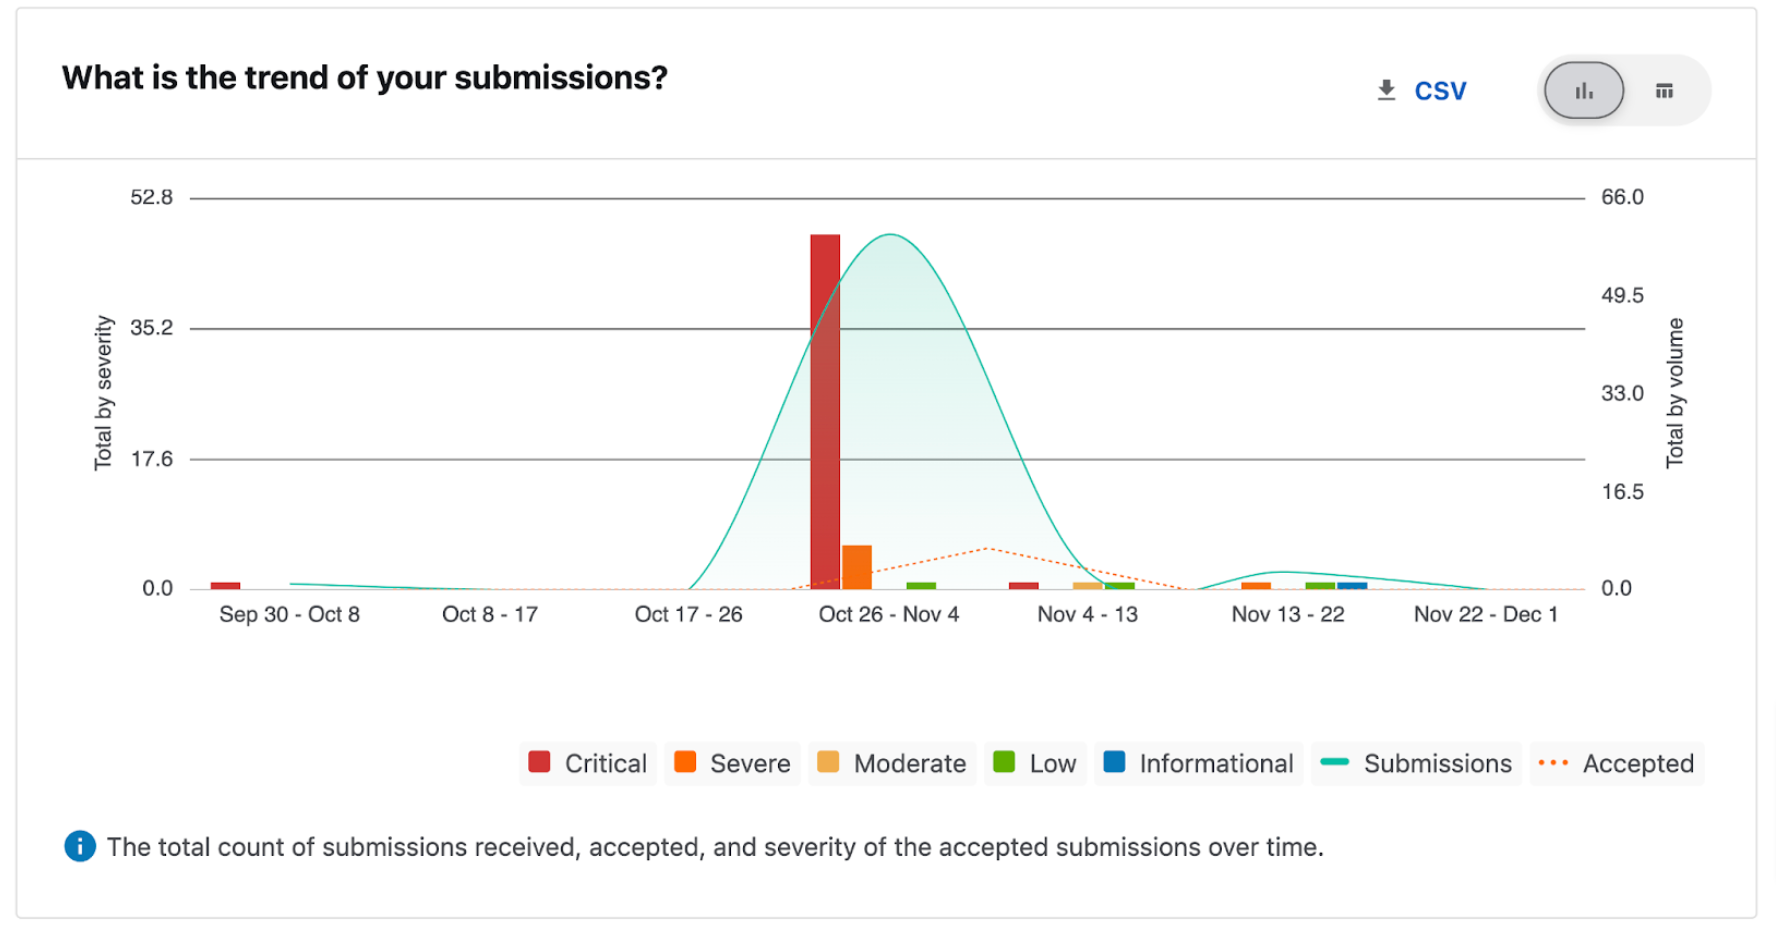
Severity and Volume Trends
This graph shows:
- A summary of severity trends
- Submissions received and accepted trends
This visual is composed of a bar chart of submission severity and a spline area chart of accepted and received submission volume:
To learn more about the metrics, please refer to submission insights metrics.
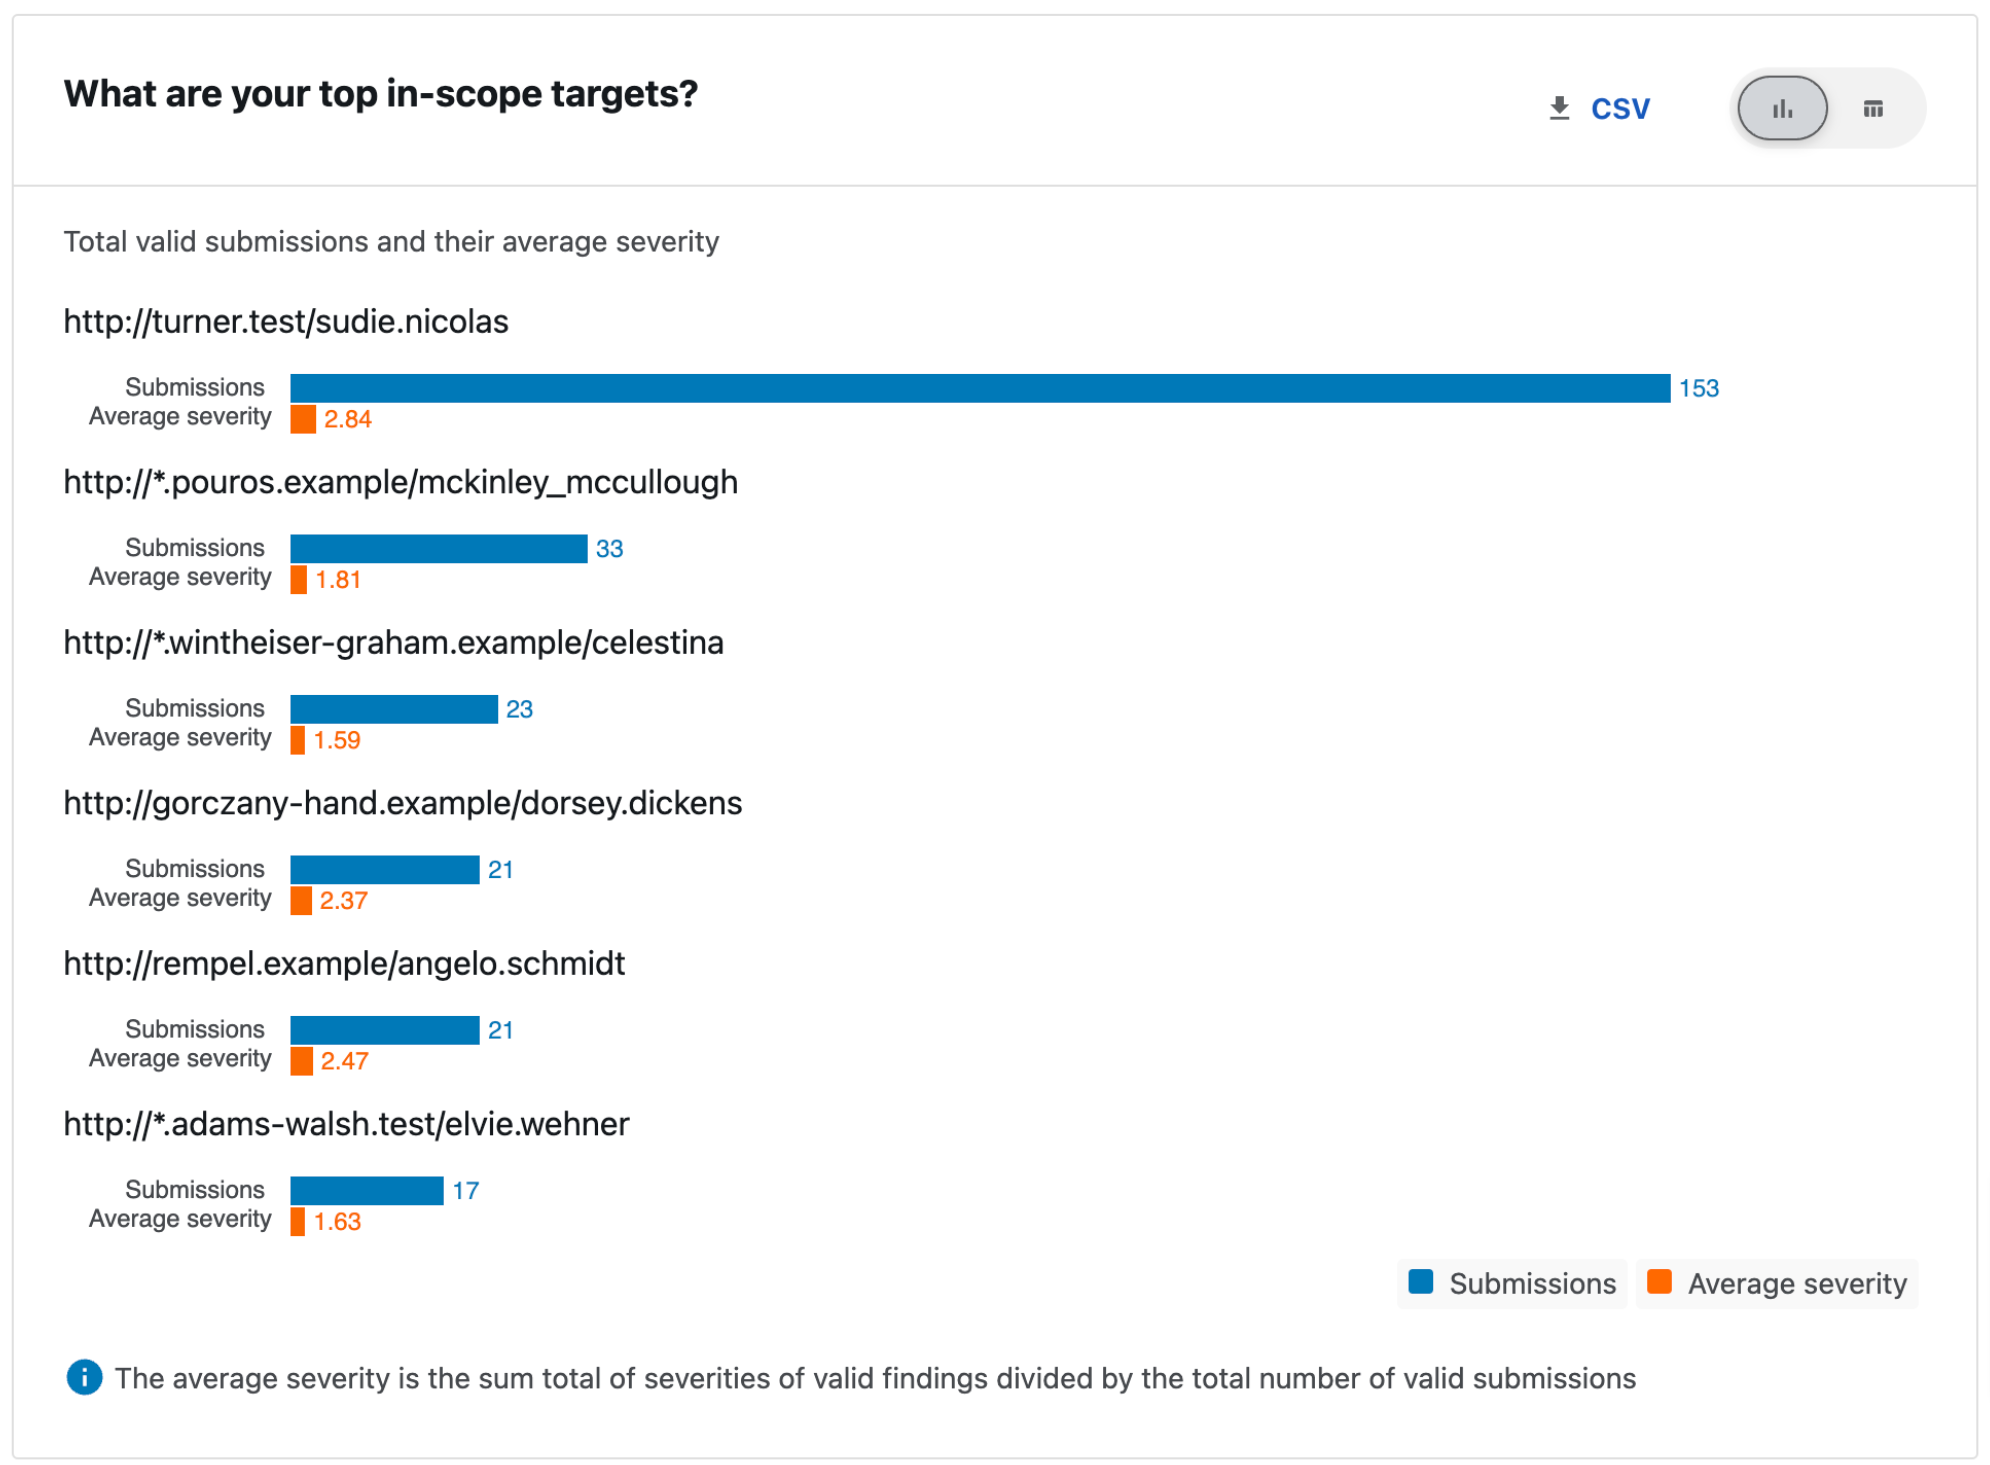
Top In-Scope Targets
Targets receiving the most valid findings, as well as the average severity of submissions for each of those targets.
A view of top in-scope targets:
To learn more, please see in-scope targets.
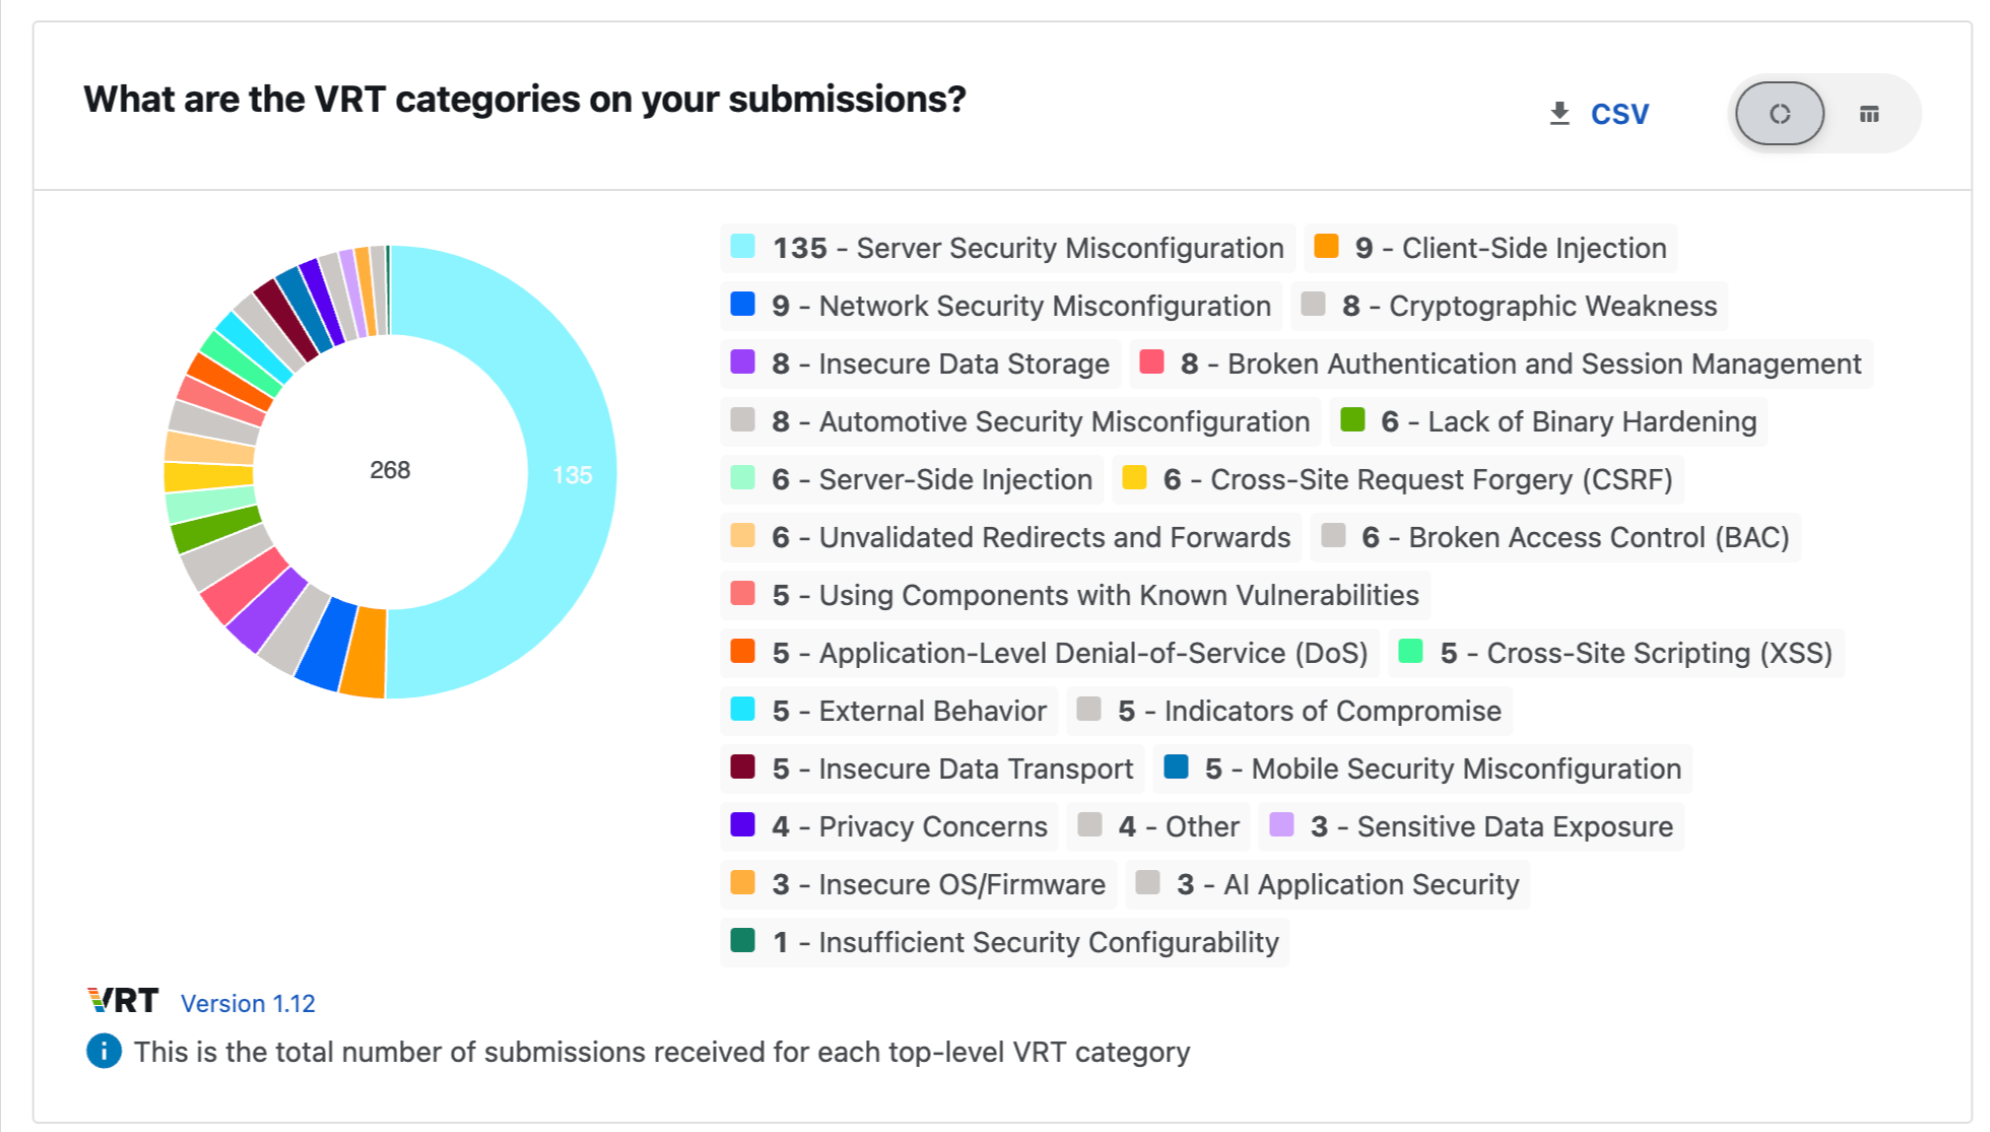
VRT Categories for your Submissions
The total number of submissions received for each Vulnerability Rating Taxonomy (VRT) category.
To learn more, please see Bugcrowd’s Vulnerability Rating Taxonomy.
Performance Overview
The Performance section provides information on how your program (and engagements) are performing, through submission transition times. The section provides the following insights:
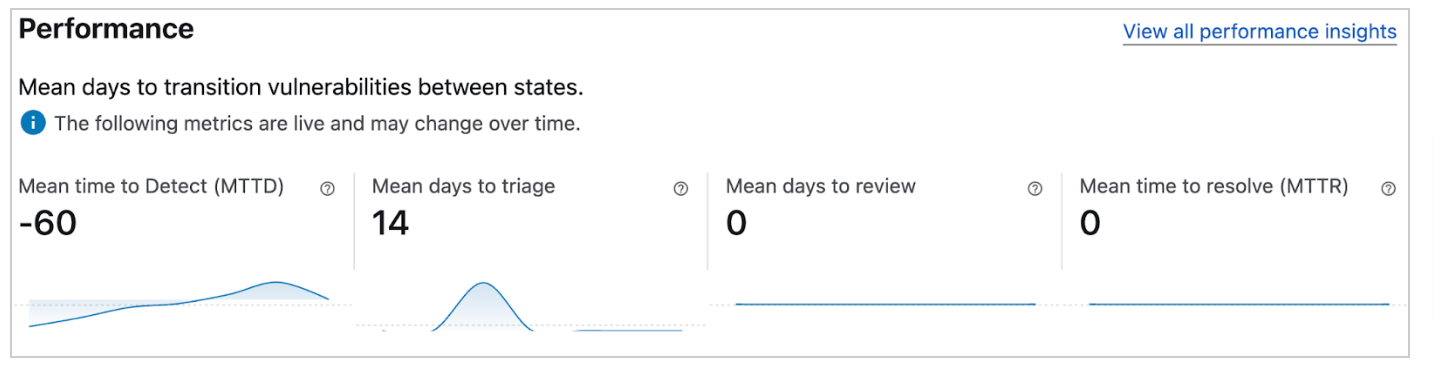
Mean Days to Transition Vulnerabilities between States: Statistics and Trends
This is a summary of mean days to transition vulnerabilities between states and minimized version of performance trends.
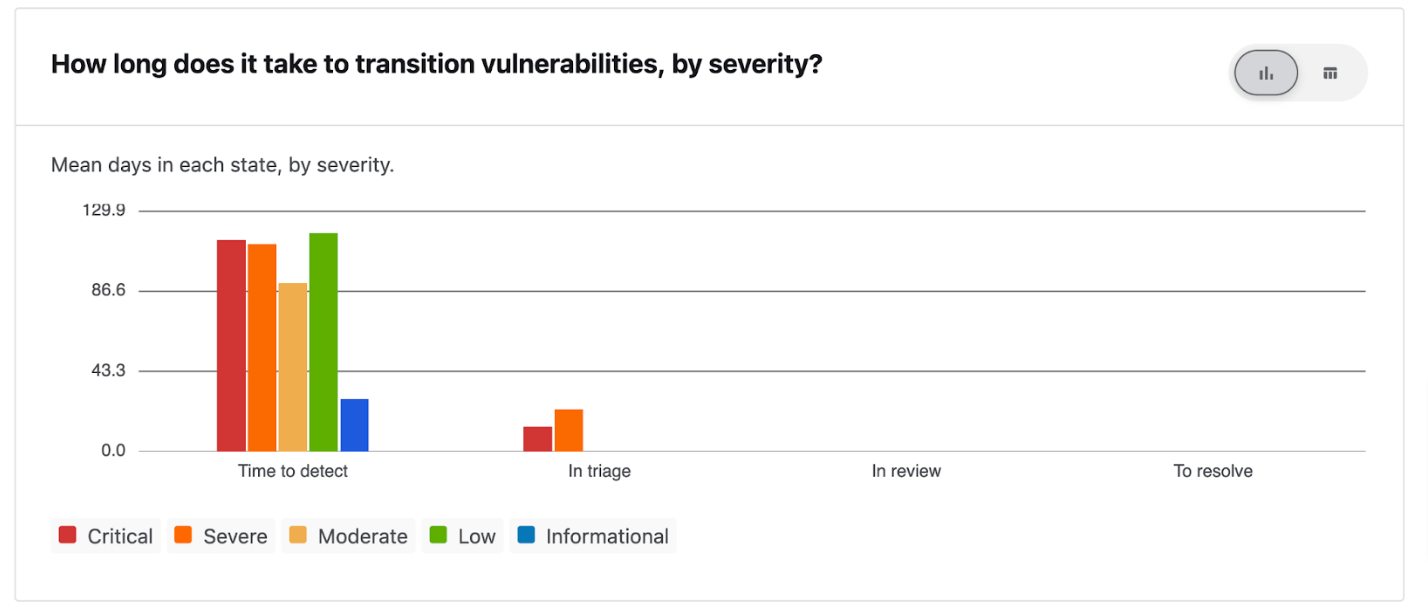
Mean Days to Transition Vulnerabilities Between States: Bar Chart
A summary of how long it takes to transition vulnerabilities, by severity.
For more details about performance, see program performance.
To learn more about the metrics, please refer to performance insights metrics.
Spend Overview
In the Spend section of the Insights Overview, you can get an overview of spend analytics about your program and engagements.
The section provides the following information:
Reward Statistics
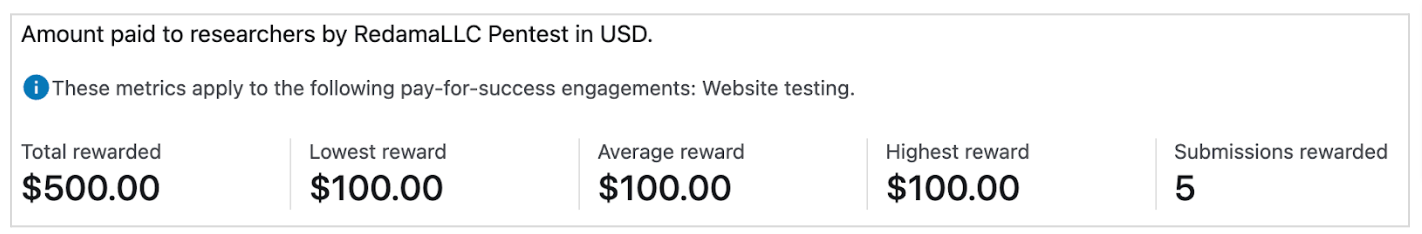
To learn more about the metrics, please refer to reward amount and number of submissions.
Rewards Over Time
Rewards over time, spline area chart view:
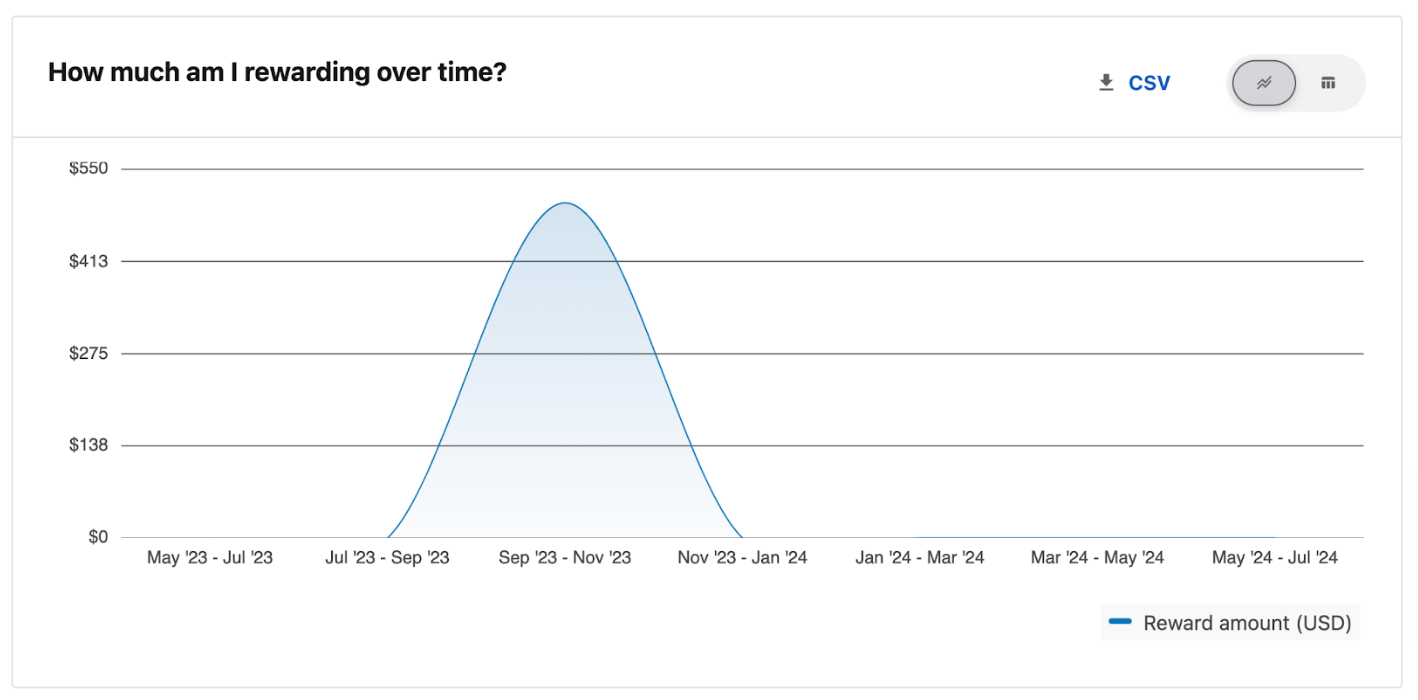
To learn more about the metrics, please refer to time and reward amount.
Rewards Over Time, by Severity
A summary of rewards paid to researchers over time by severity.
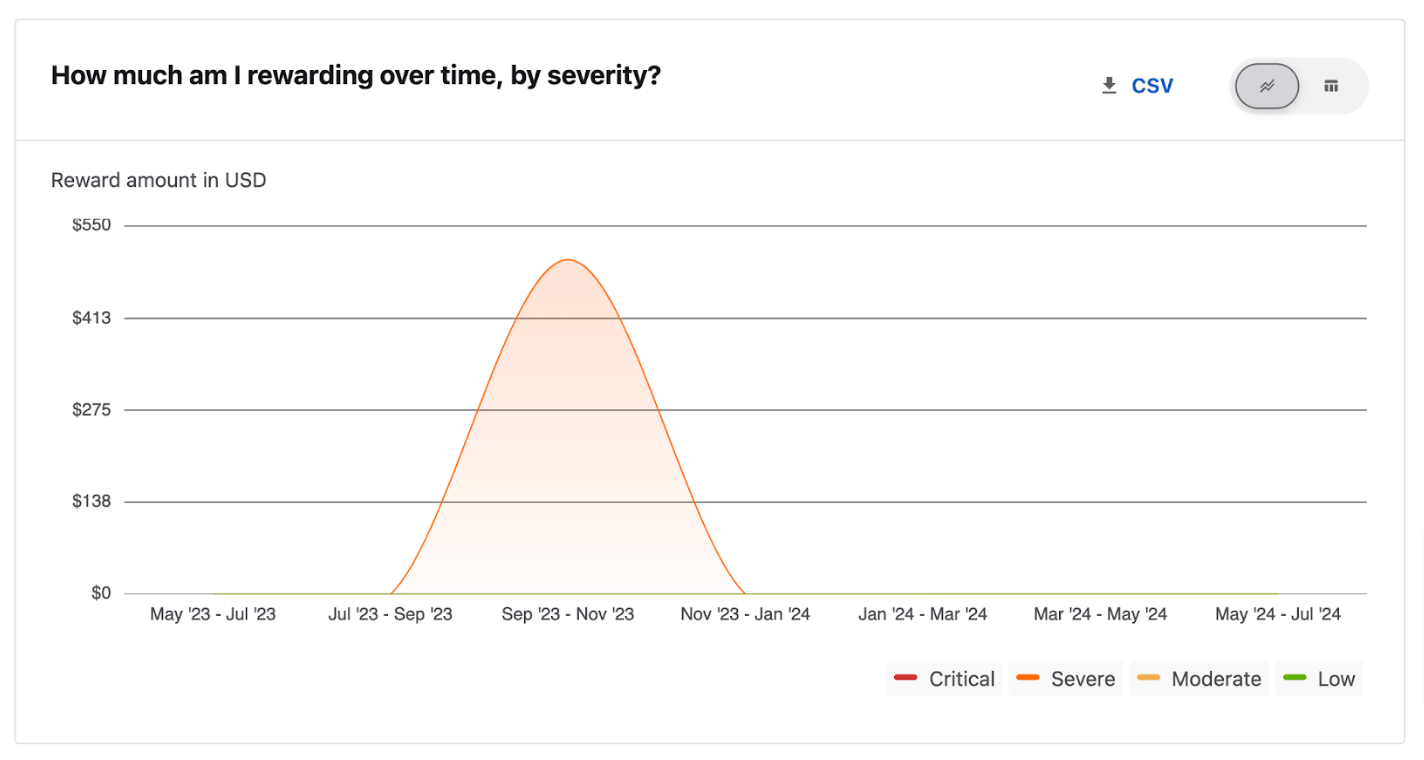
For more details, see rewards over time by severity.