- Submission State Statistics
- Submission Severity Trends
- Submission State Trends
- Top In-Scope Targets
- VRT Categories for Your Submission
The Insights Submissions section provides aggregate data across your engagements at the Security Program level.
Submission State Statistics
In detailed view statistics and trends are segregated into two different views, a stats view and trends view.

To learn more about the metrics, please refer to Submission States Metrics.
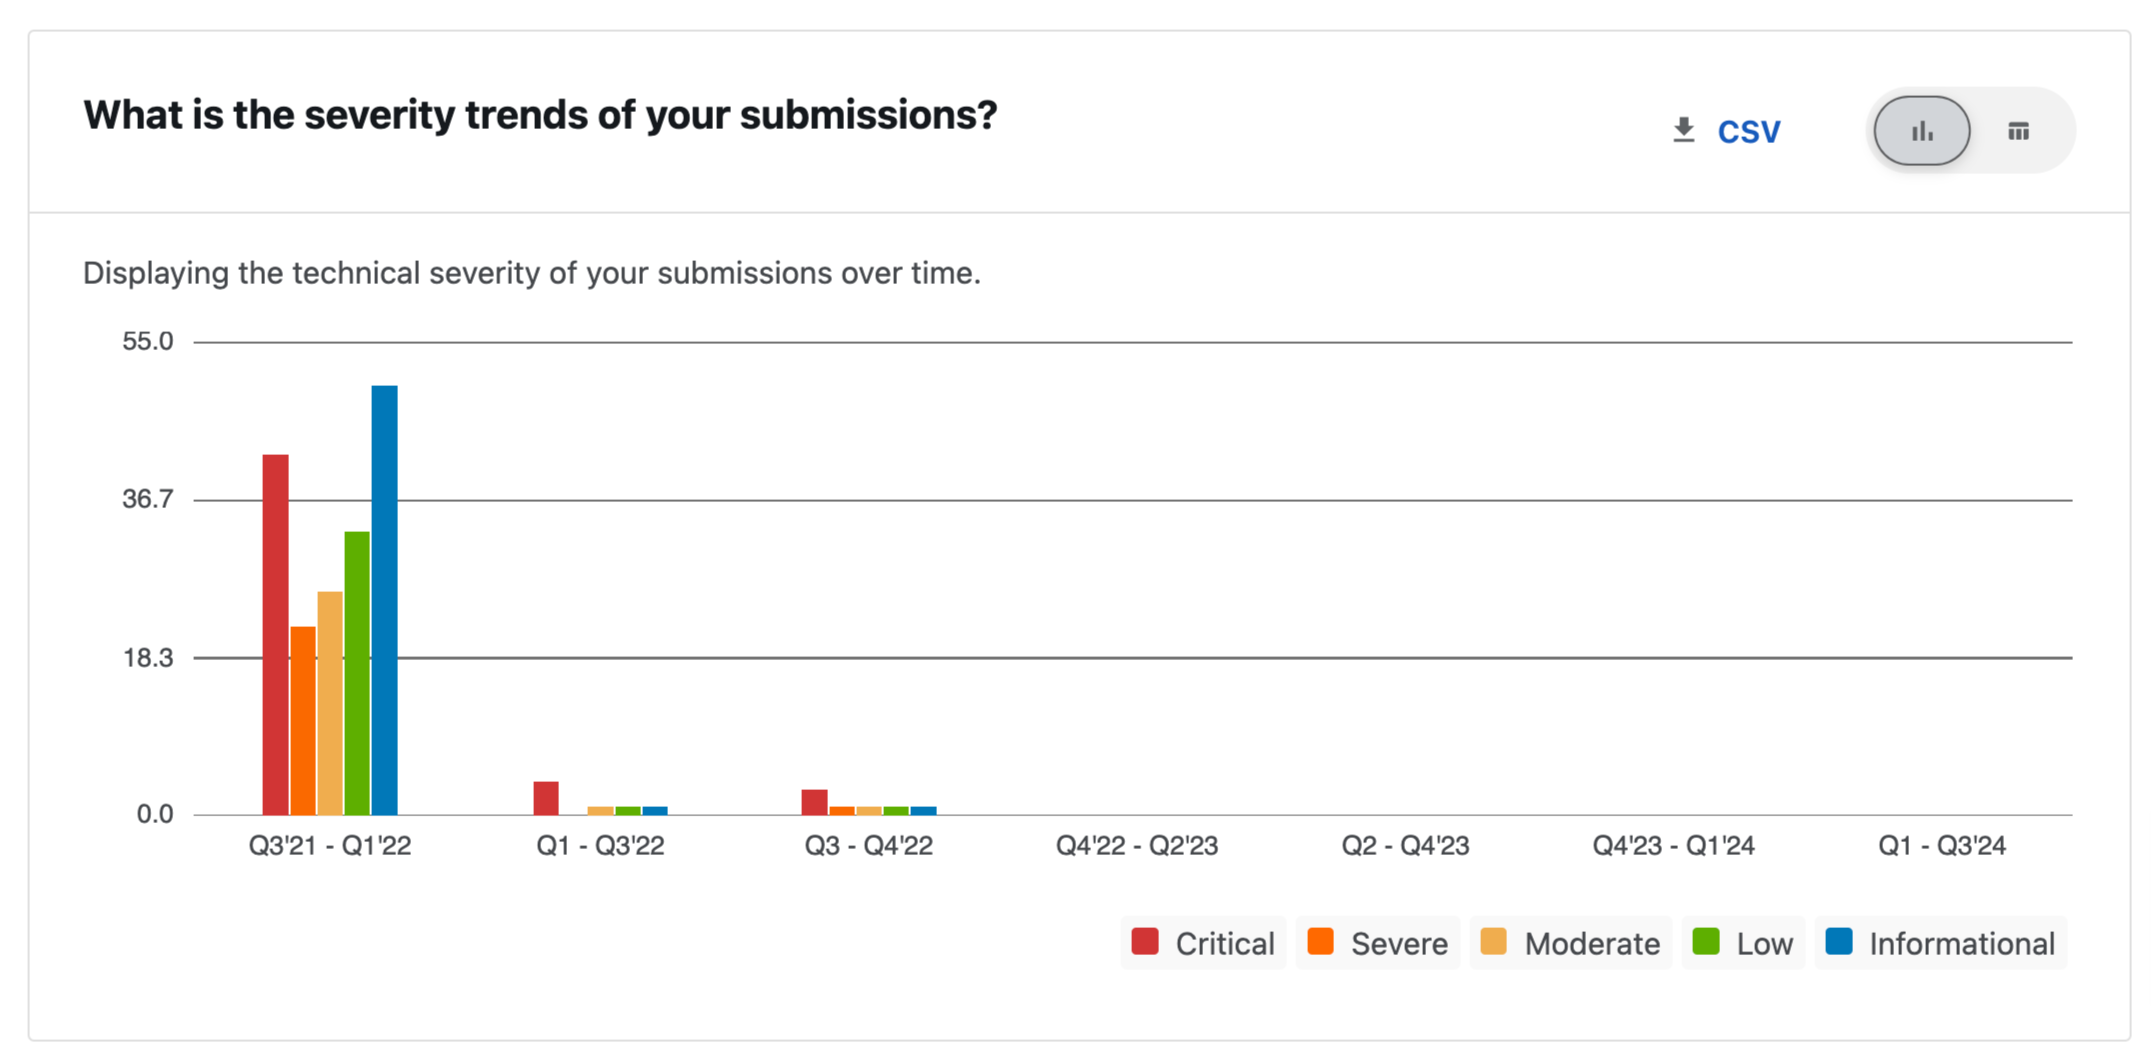
Submission Severity Trends
This graph shows the severity trends of submissions.
Severity trends, bar chart view:
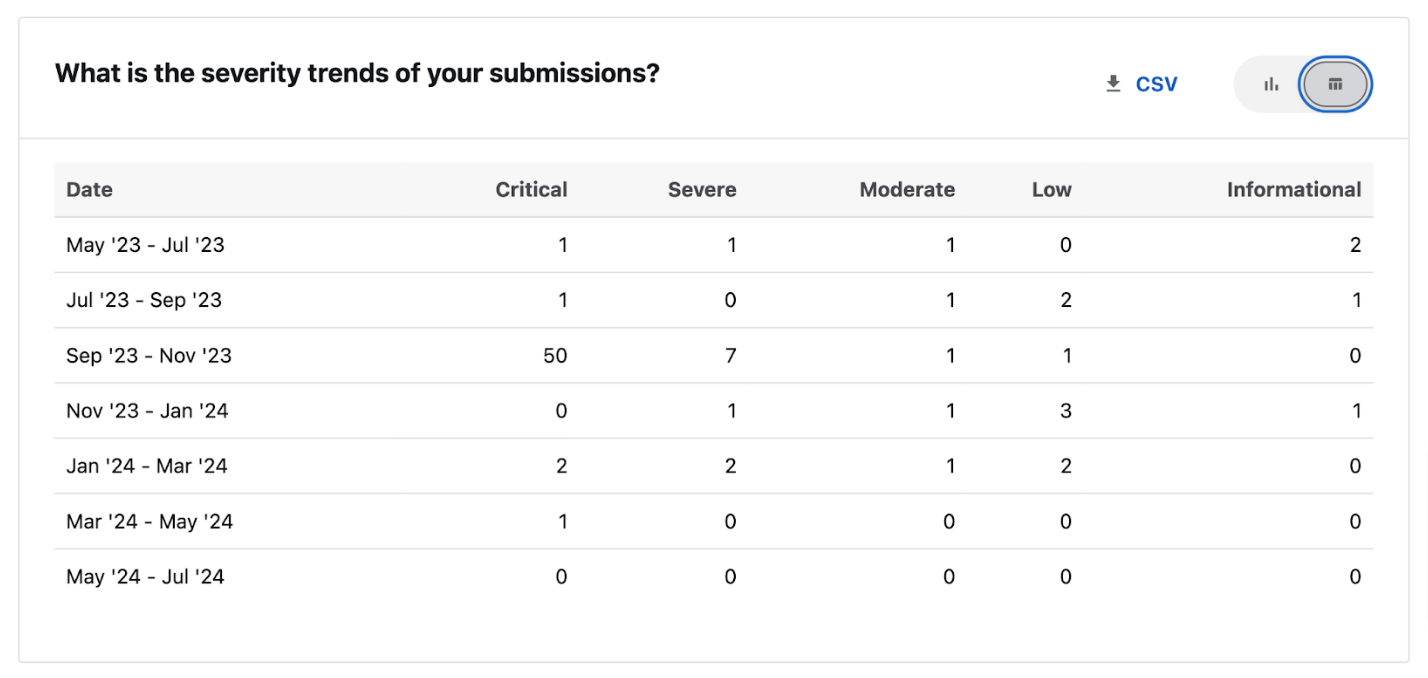
Severity trends, table view:
To learn more about the metrics, please refer to Submission Severity Metrics.
Submission State Trends
The submission state trend charts focus on these four specific states:
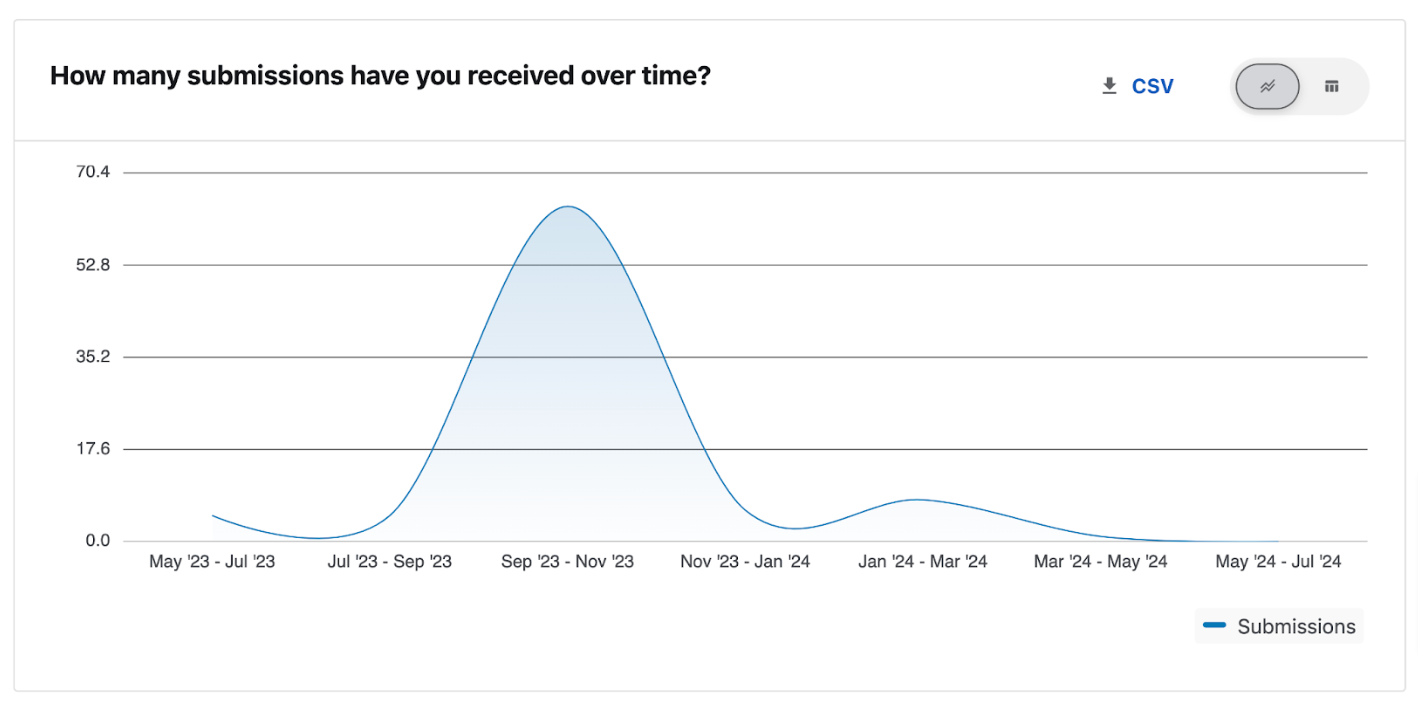
- Submissions Received over time
- Submissions Triaged over time
- Submissions Accepted over time
Submissions received over time, spline area chart view:
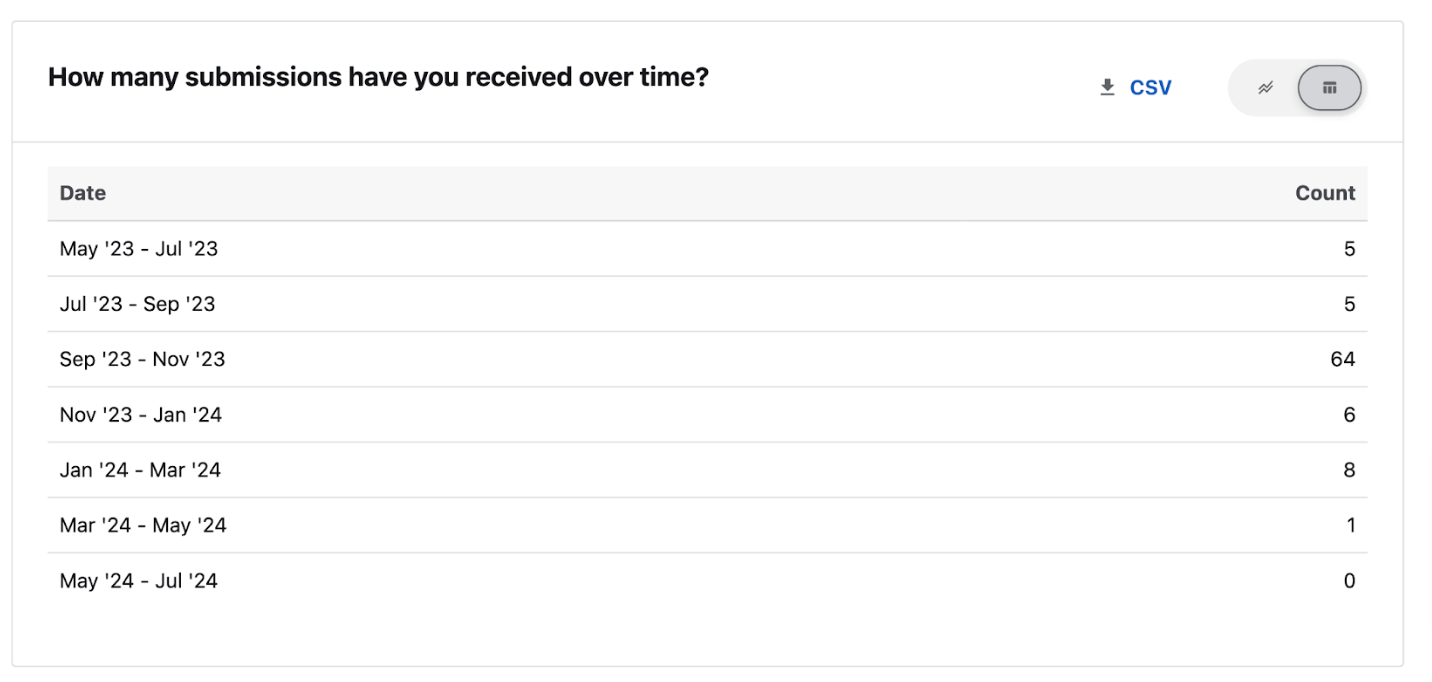
Submissions received over time, table view:
To learn more about the metrics, please refer to Submission States Metrics.
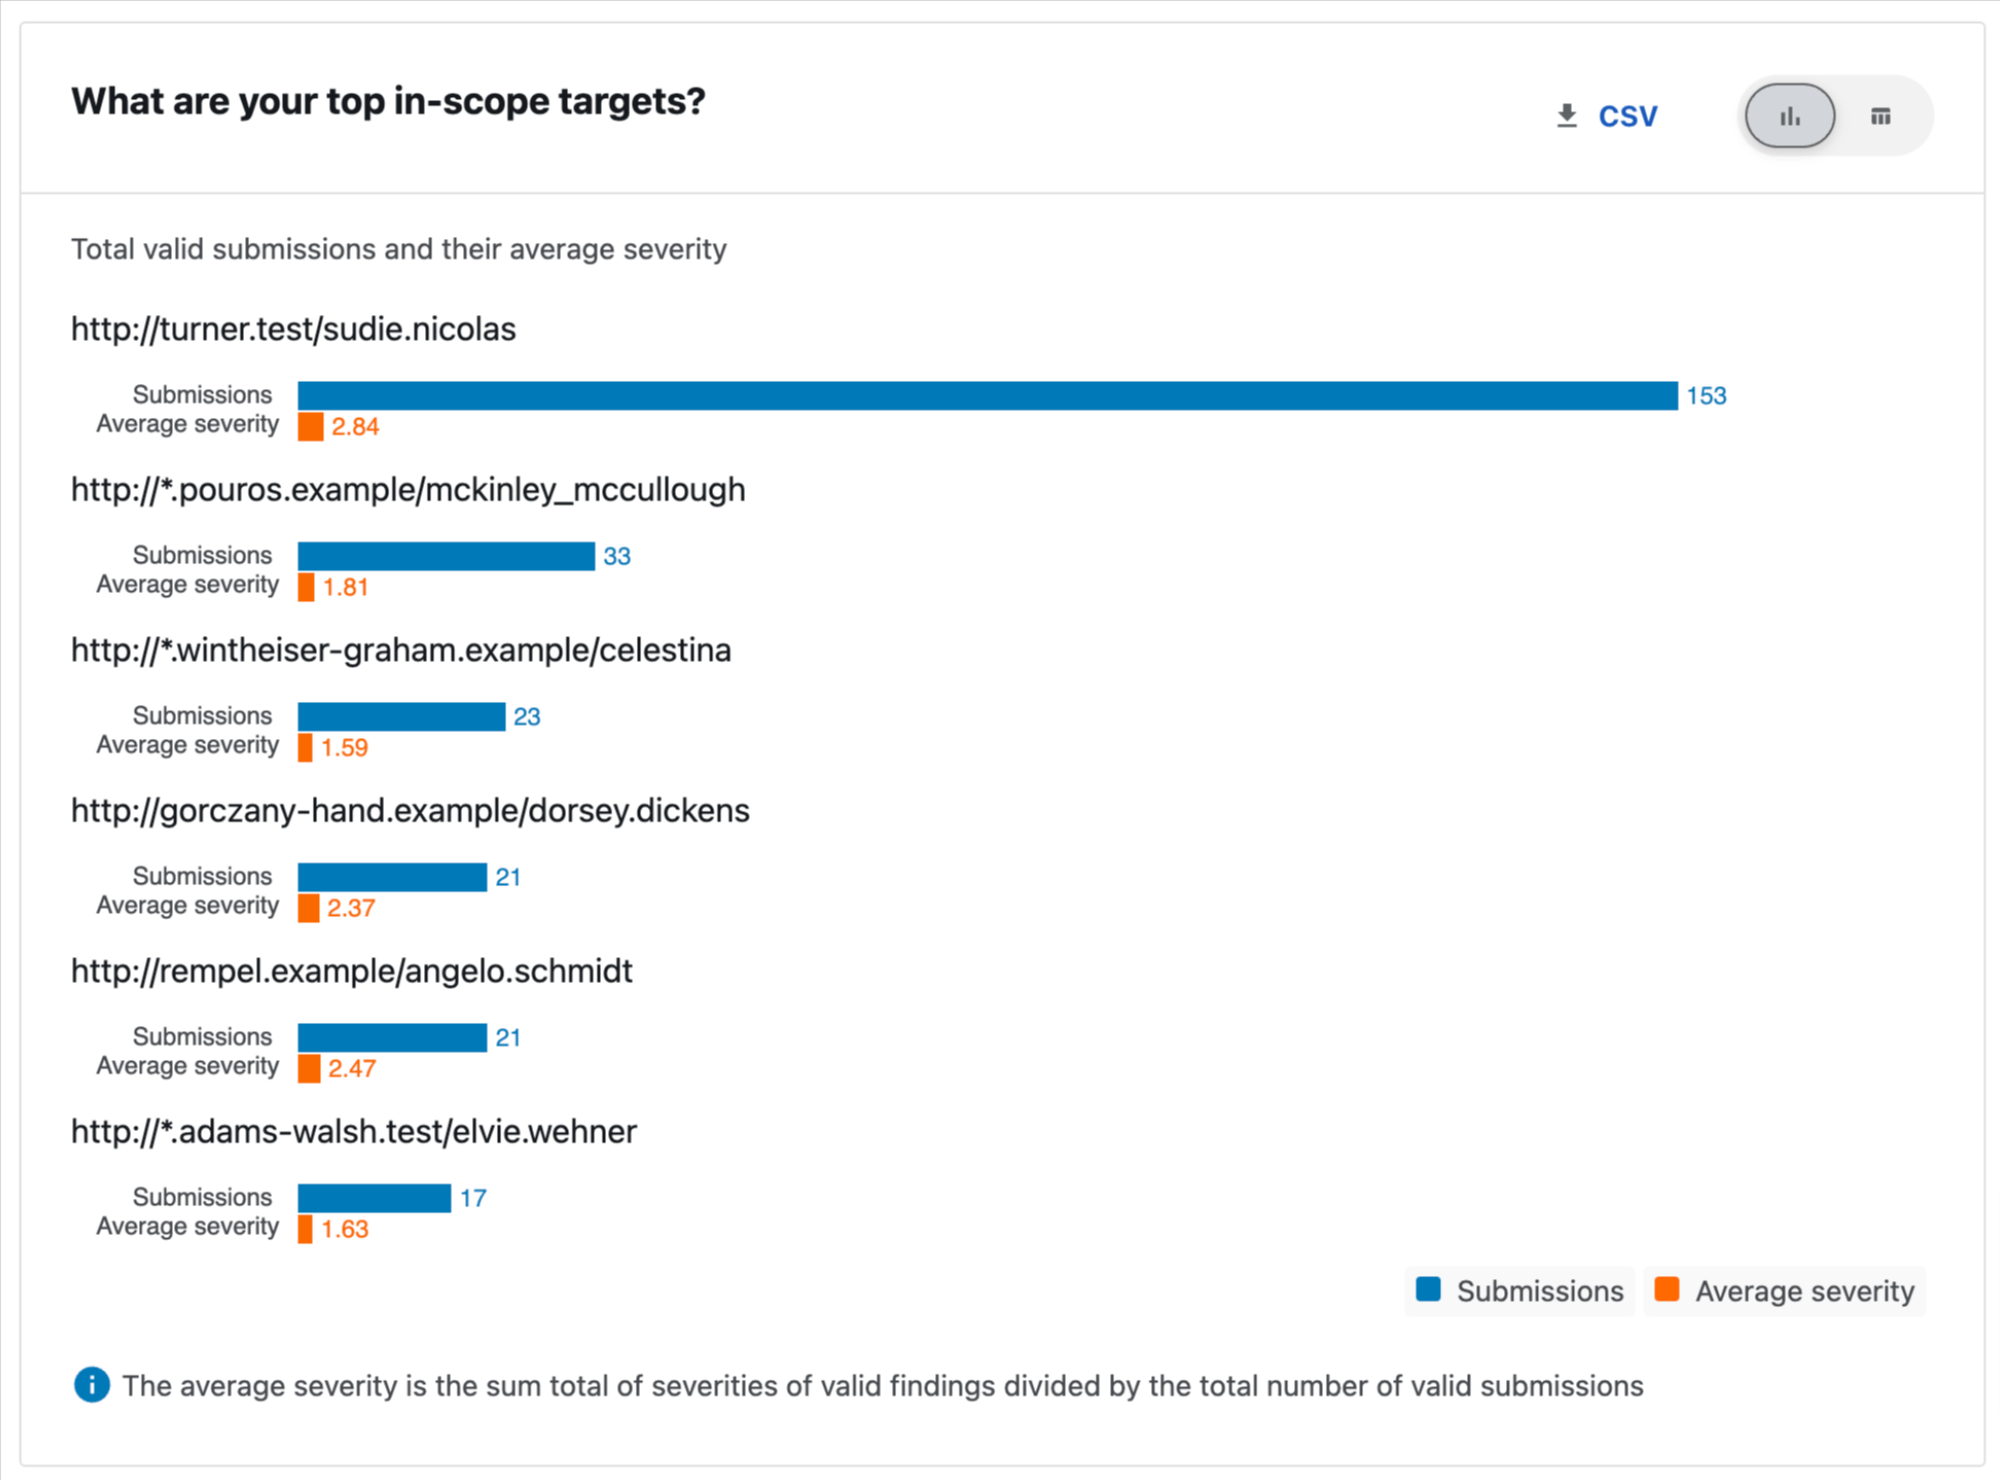
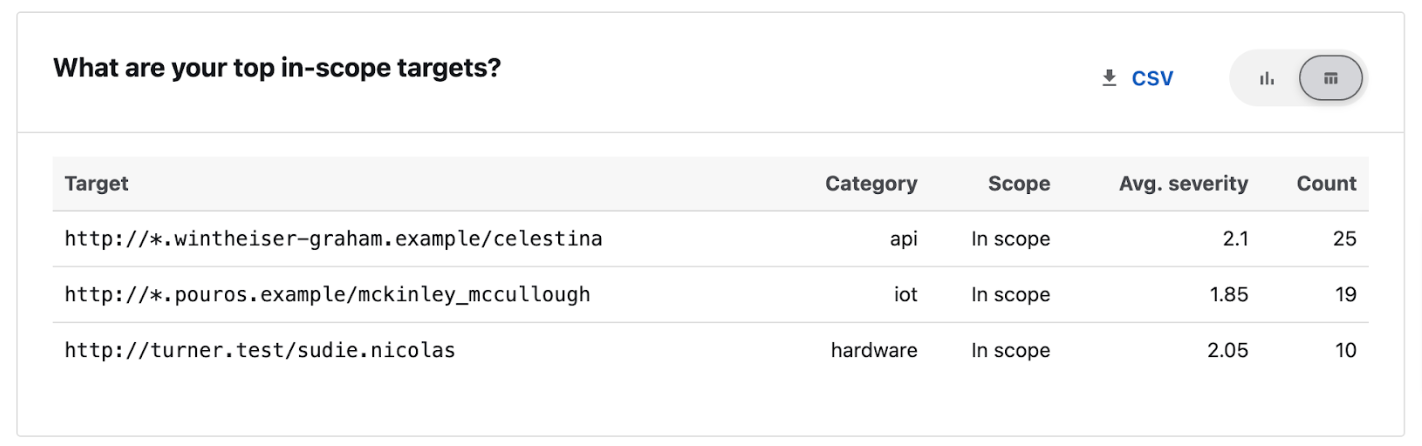
Top In-Scope Targets
This section shows the targets with the most number of valid submissions.
Top in-scope targets, horizontal bar chart view:
Top in-scope targets, table view:
To learn more about the metrics, please refer to Submissions In-Scope and Severity Metrics.
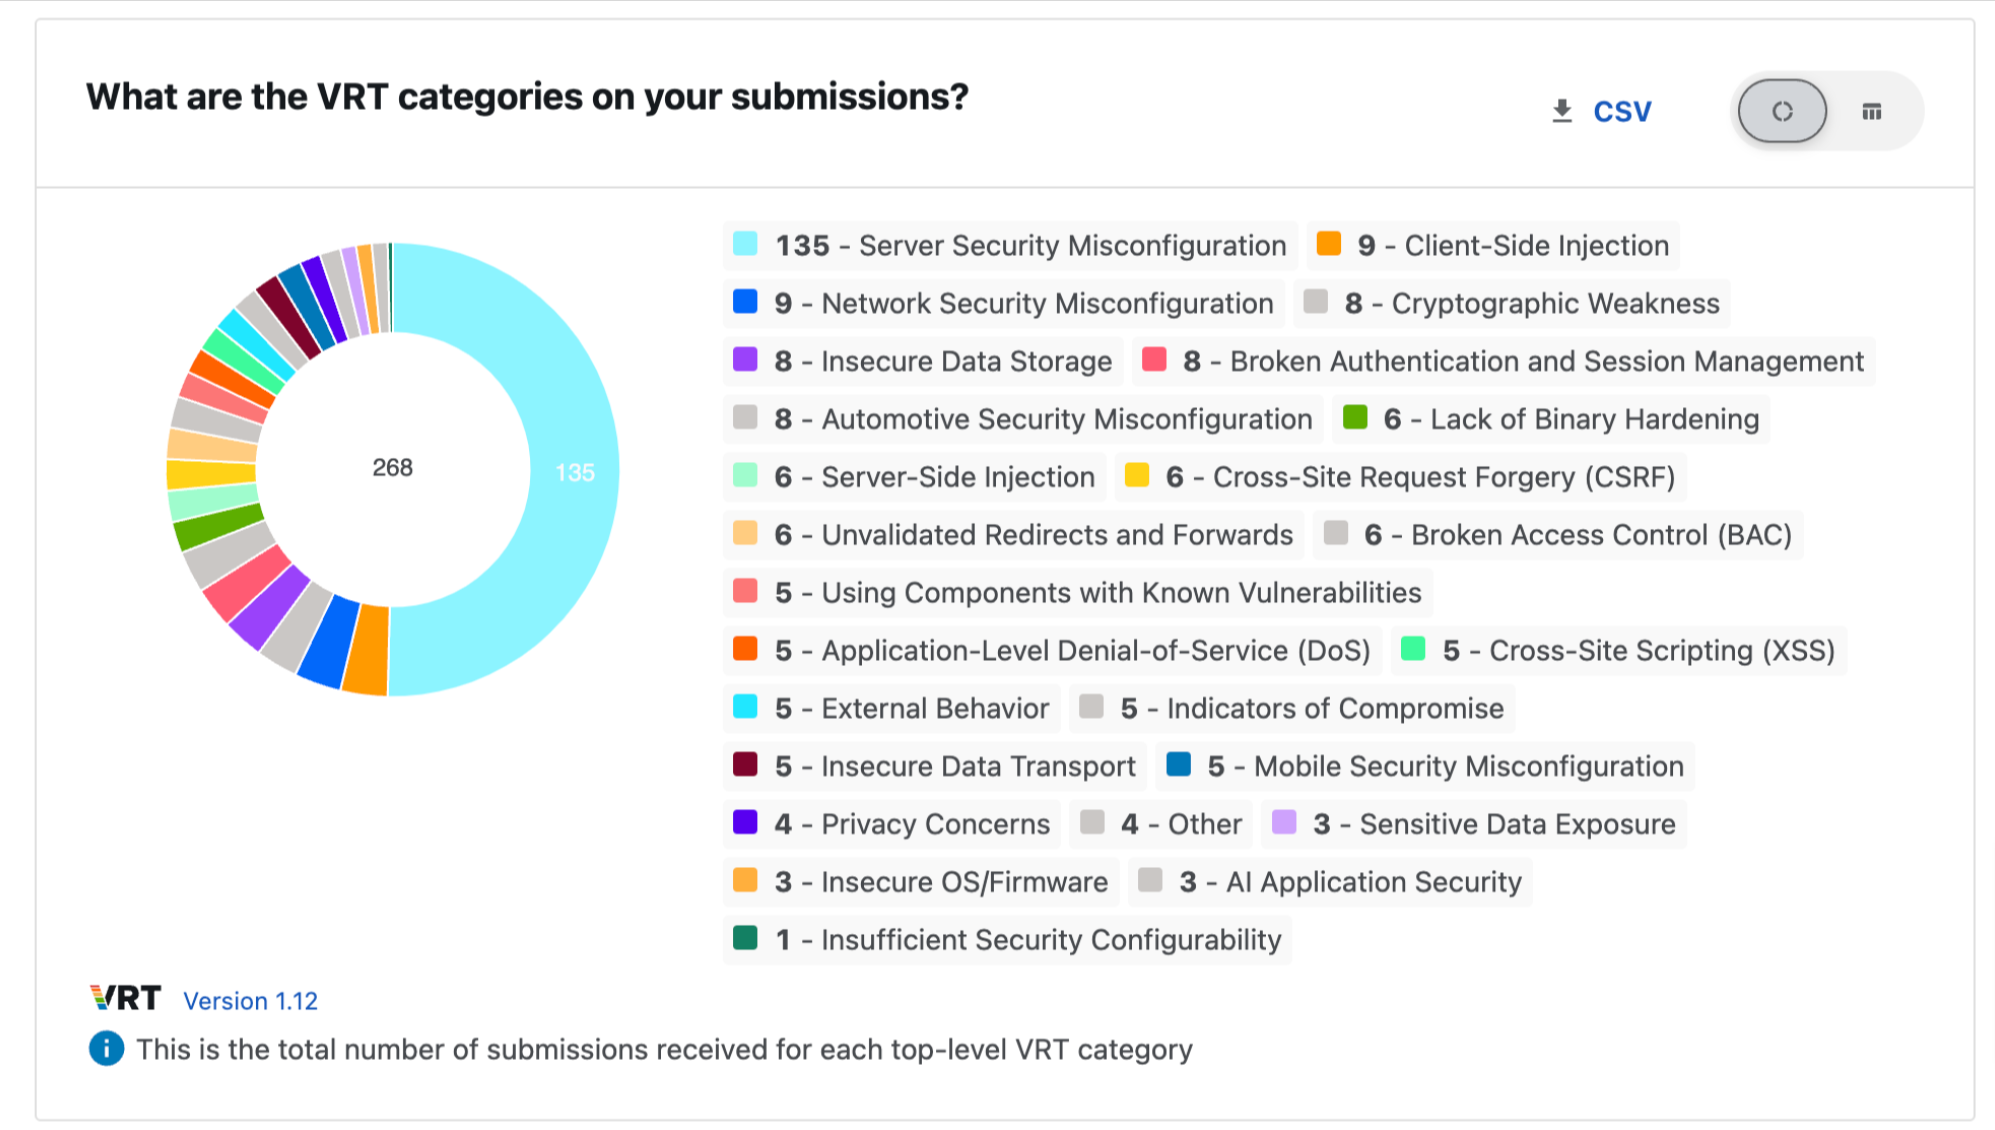
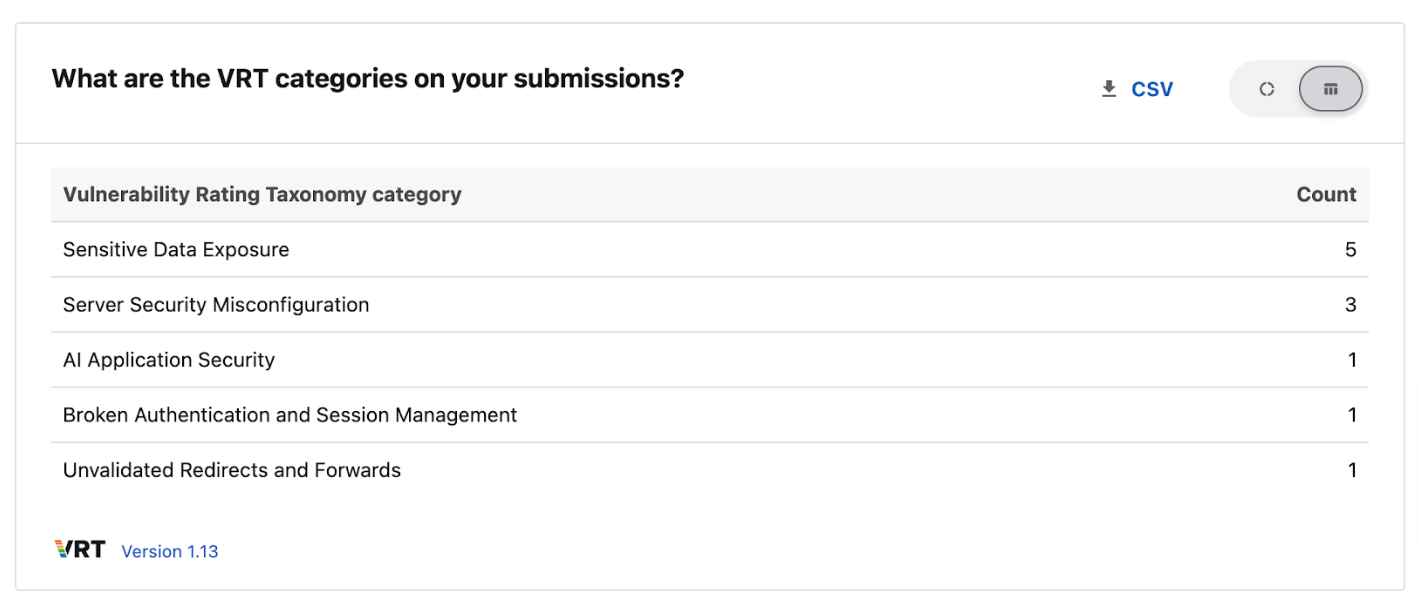
VRT Categories for Your Submission
This section lists the most common vulnerability categories found in your assets. You can view the count of submissions, broken down by top level VRT Rating Taxonomy category.
VRT categories, doughnut chart view:
VRT categories, table view:
To learn more about the metrics, please refer to Submissions and VRT Category Metrics.