- Submission Status Transition Statistics
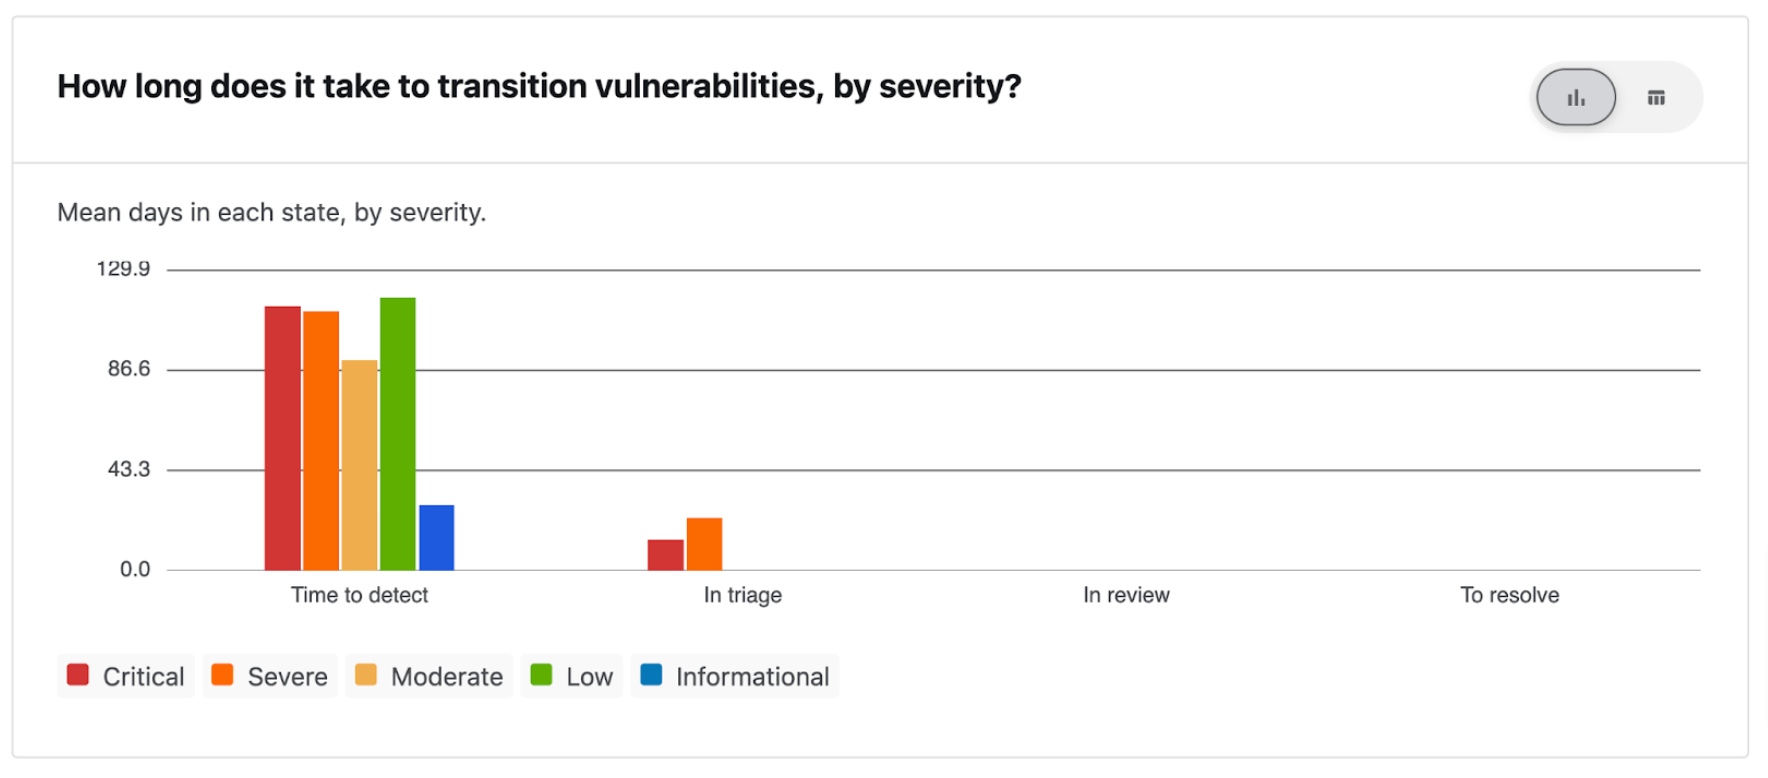
- Submission Status Transition Bar Chart
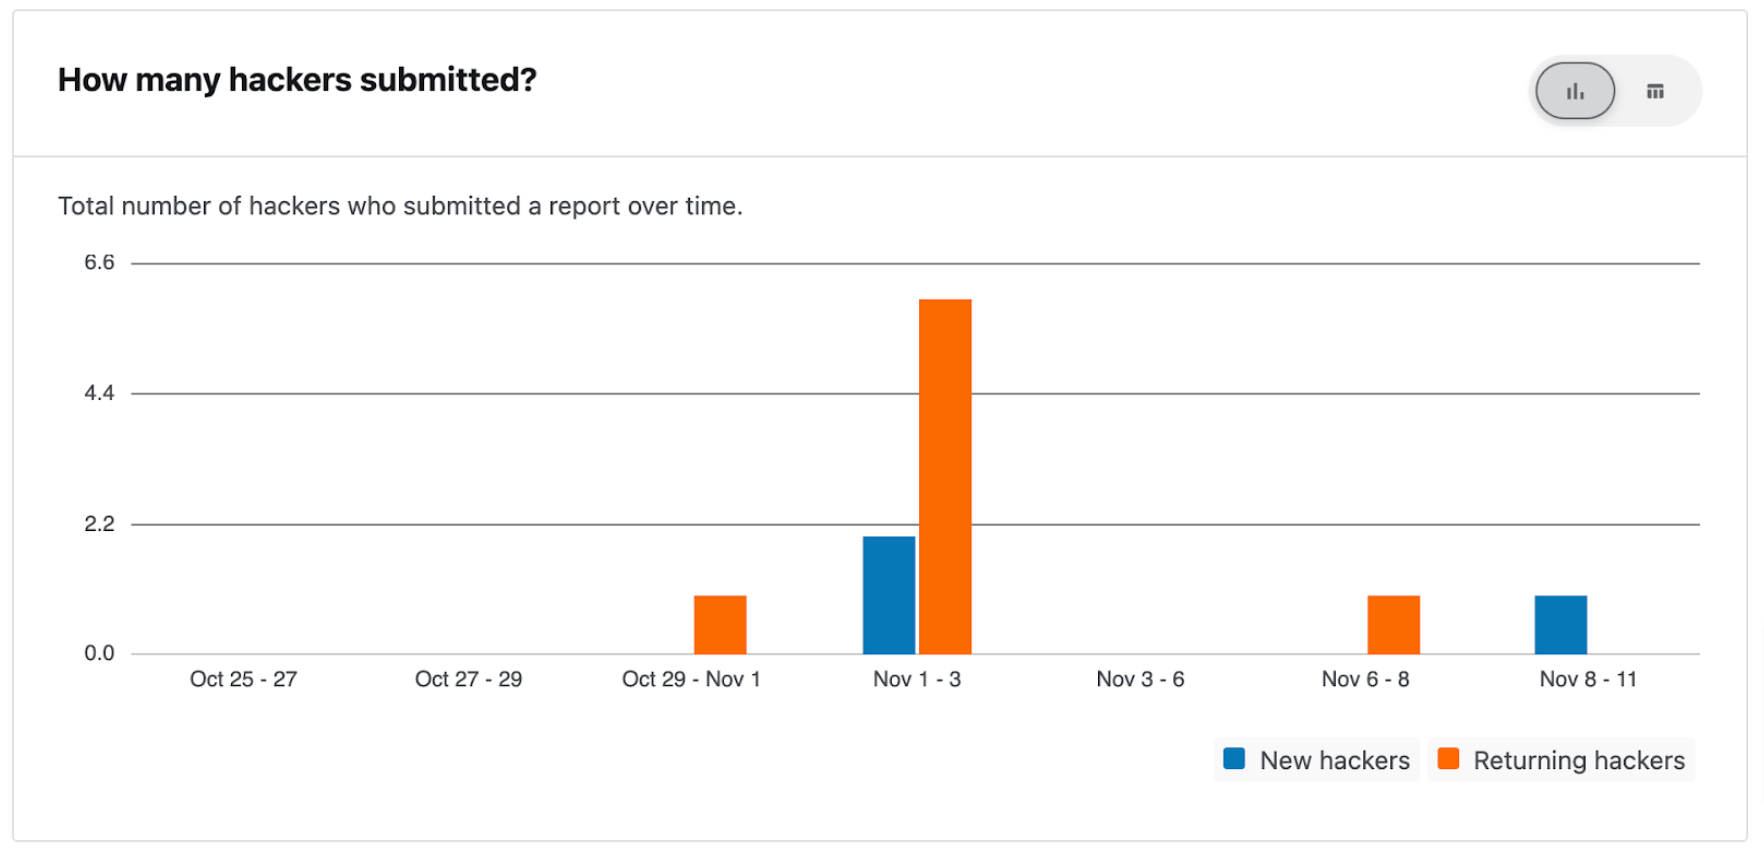
- Hacker Trends
- Submission Status by Severity
- Performance Trends
Performance analytics provides details on the health of your Security Program through submission status transition times through a submission’s lifecycle. Shorter status transition times indicate good responsiveness to hackers and overall health of a program, which encourages hackers to continue testing and leads to better results.
Submission Status Transition Statistics
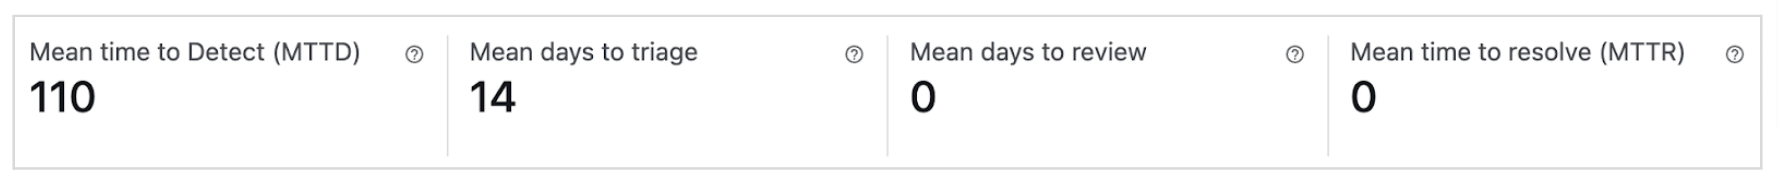
To learn more about the metrics, please refer to Mean Days Submission States and Severity.
Submission Status Transition Bar Chart
Submission status transition, bar chart view:
Submission status transition, table view:
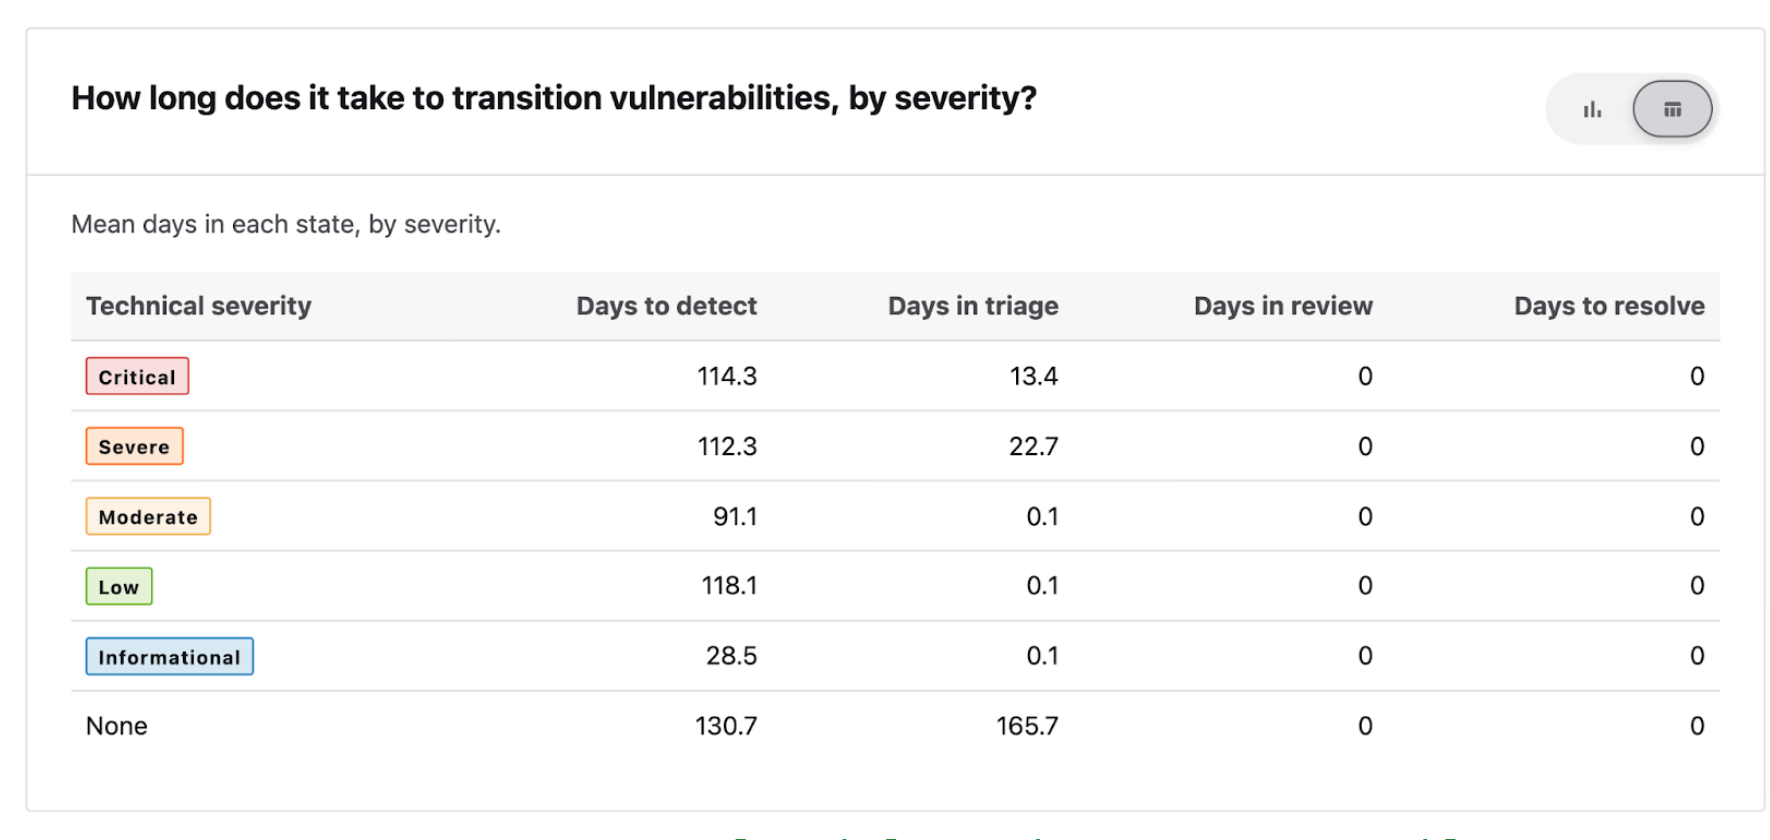
To learn more about the metrics, please refer to Mean Days Submission States and Severity.
Hacker Trends
How many hackers submitted bar chart view:
How many hackers submitted table view:
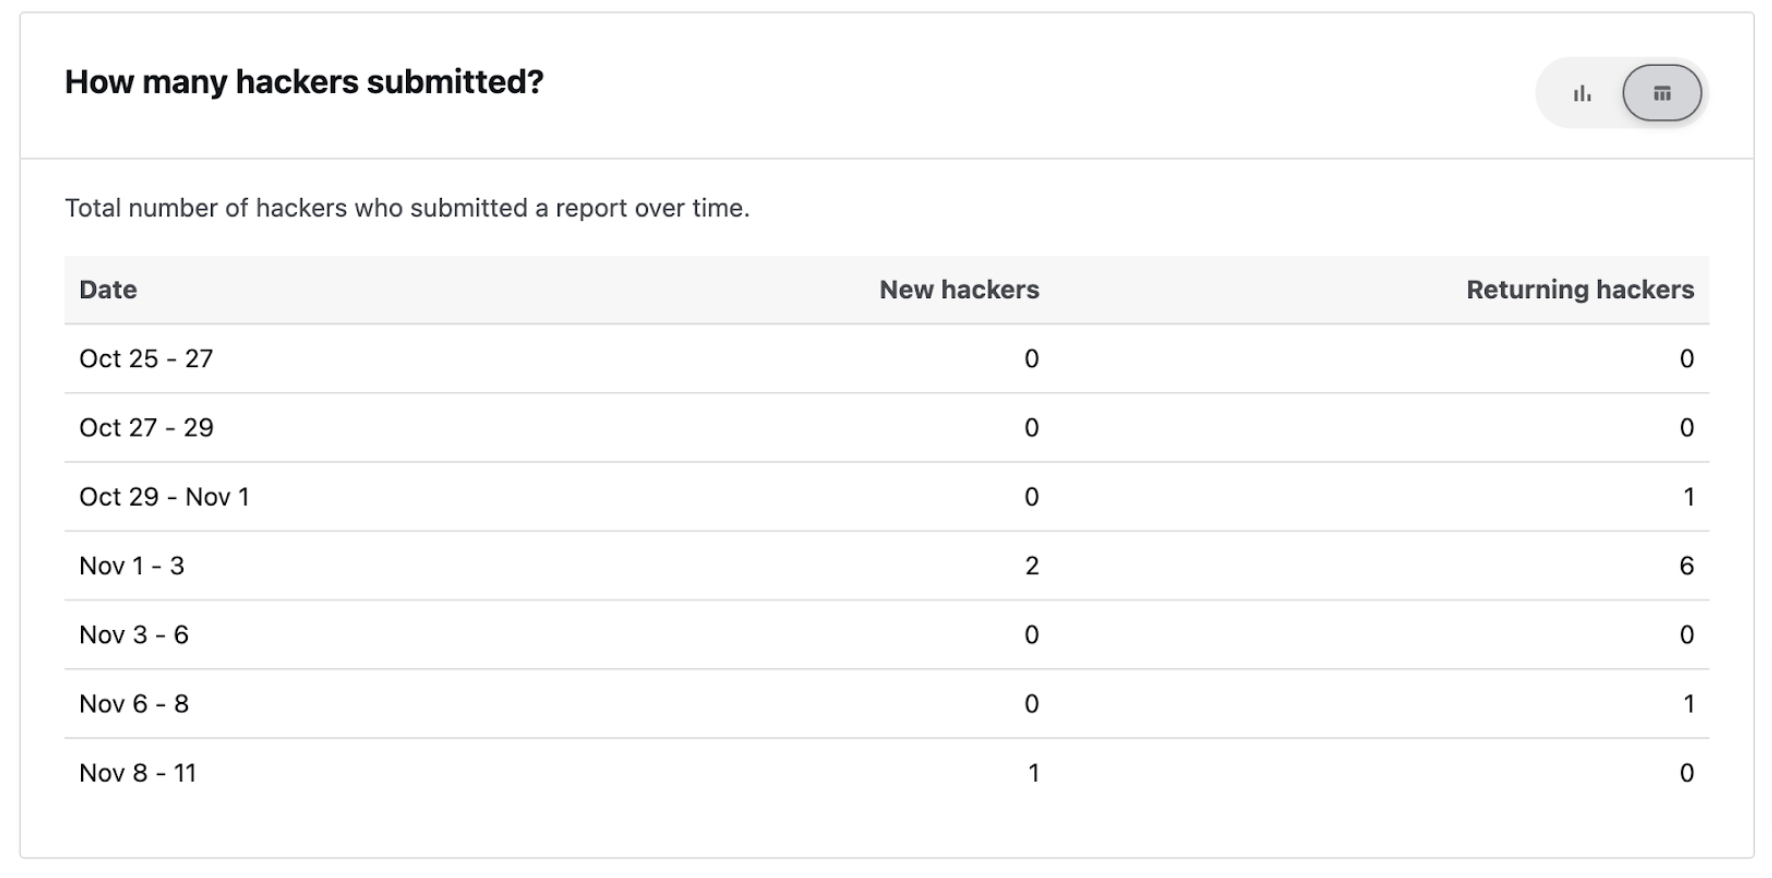
To learn more about the metrics, please refer to Researchers and Time.
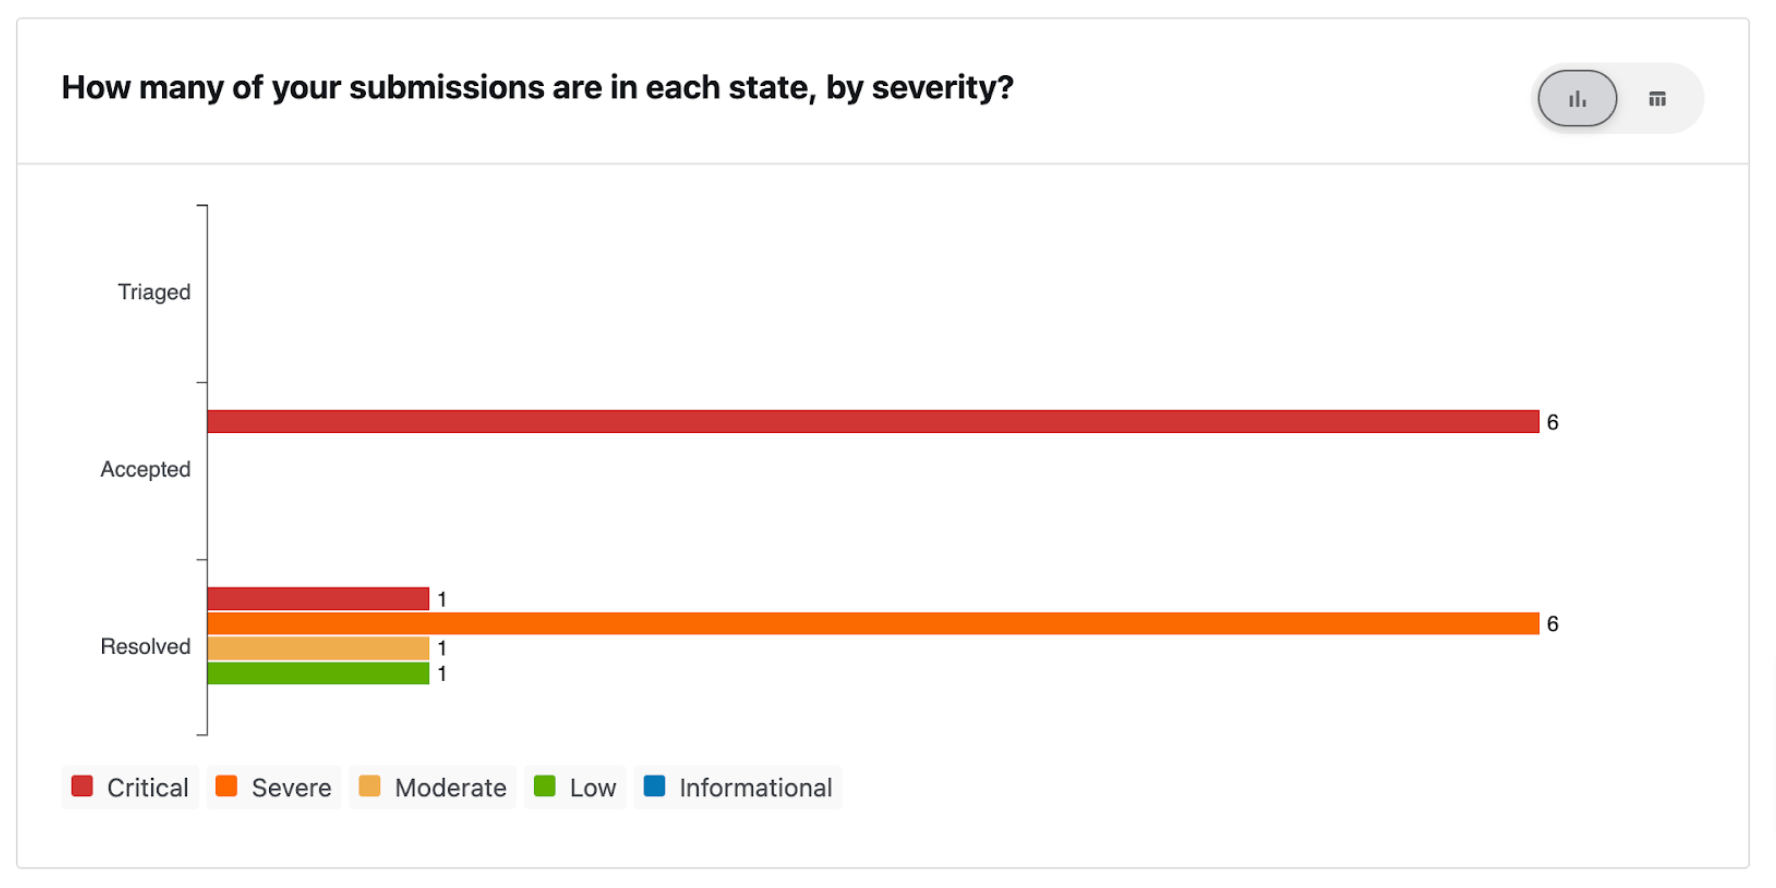
Submission Status by Severity
Submission status by severity, bar chart view:
Submission status by severity, table view:
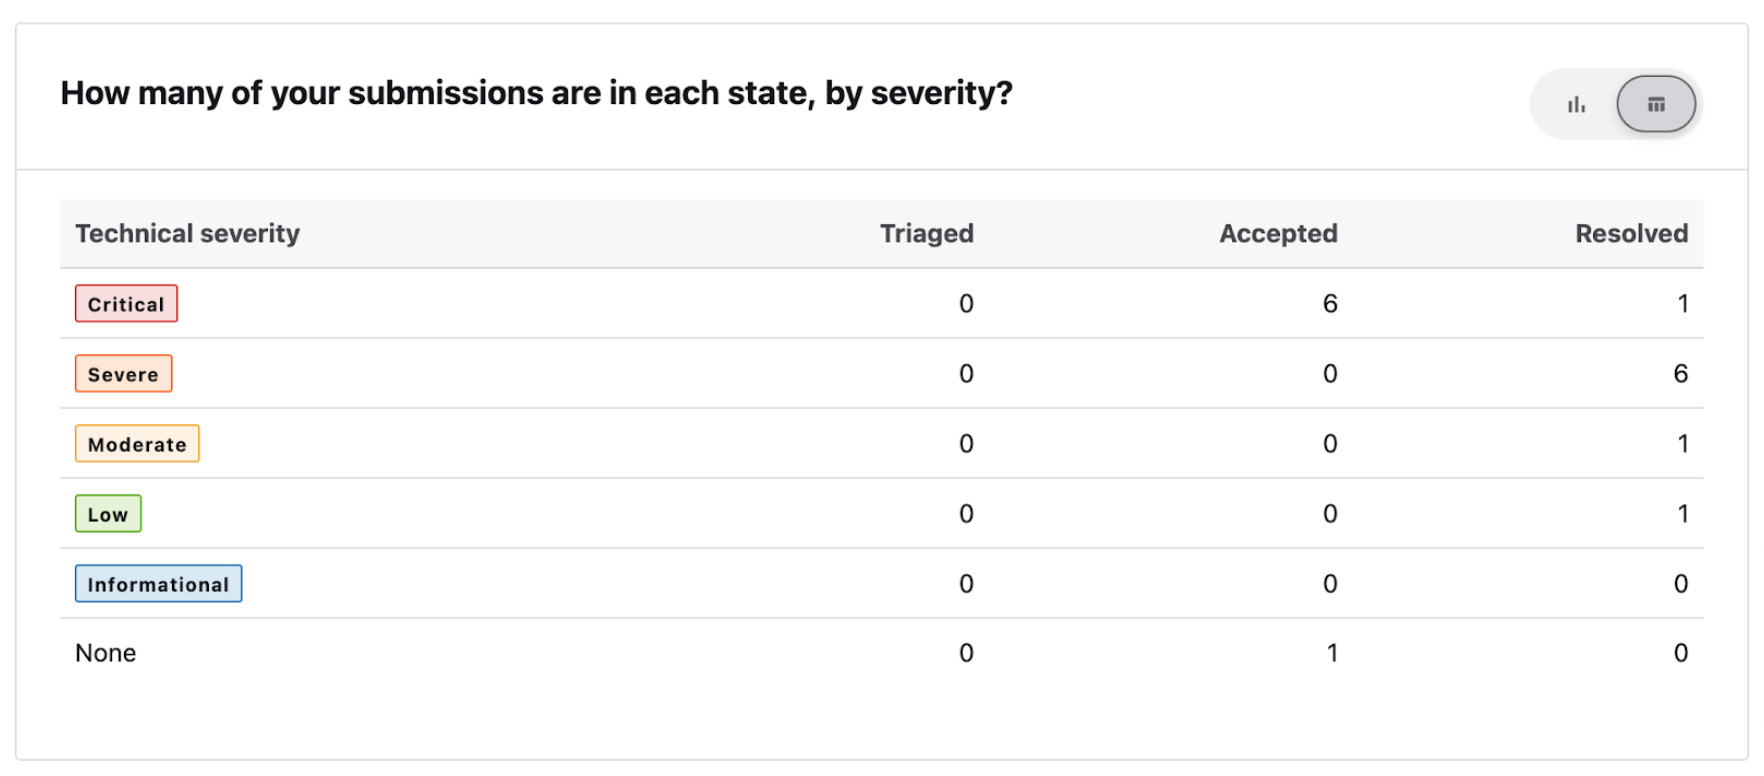
To learn more about the metrics, please refer to Submission State and Severity.
To learn more about severity, please refer to Bugcrowd documentation.
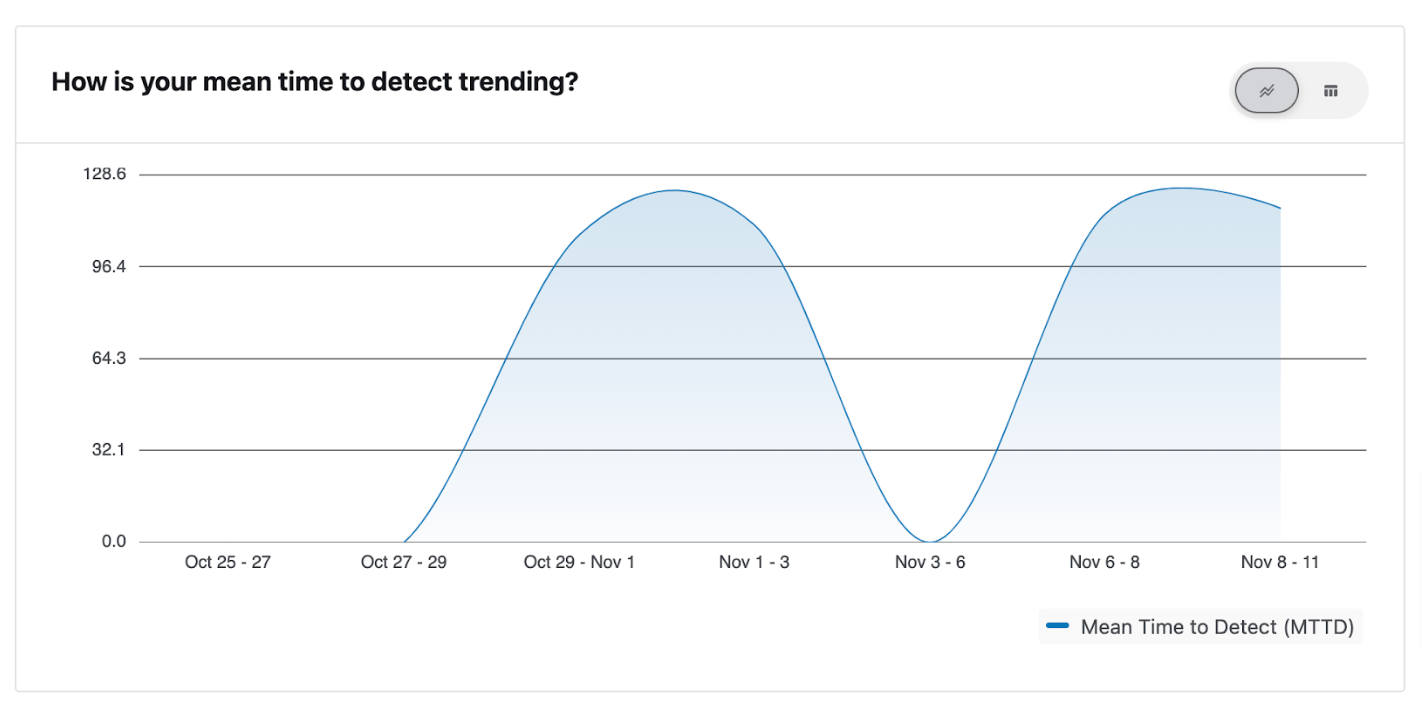
Performance Trends
All performance trends have similar metric definitions, with similar chart and table views. They cover 4 values:
- Mean time to Detect trends
- Mean days in Triage trends
- Mean days in Review trends
- Mean time to Resolve trends
Mean time to detect trends, spline-area chart view:
Mean time to detect trends, table view:
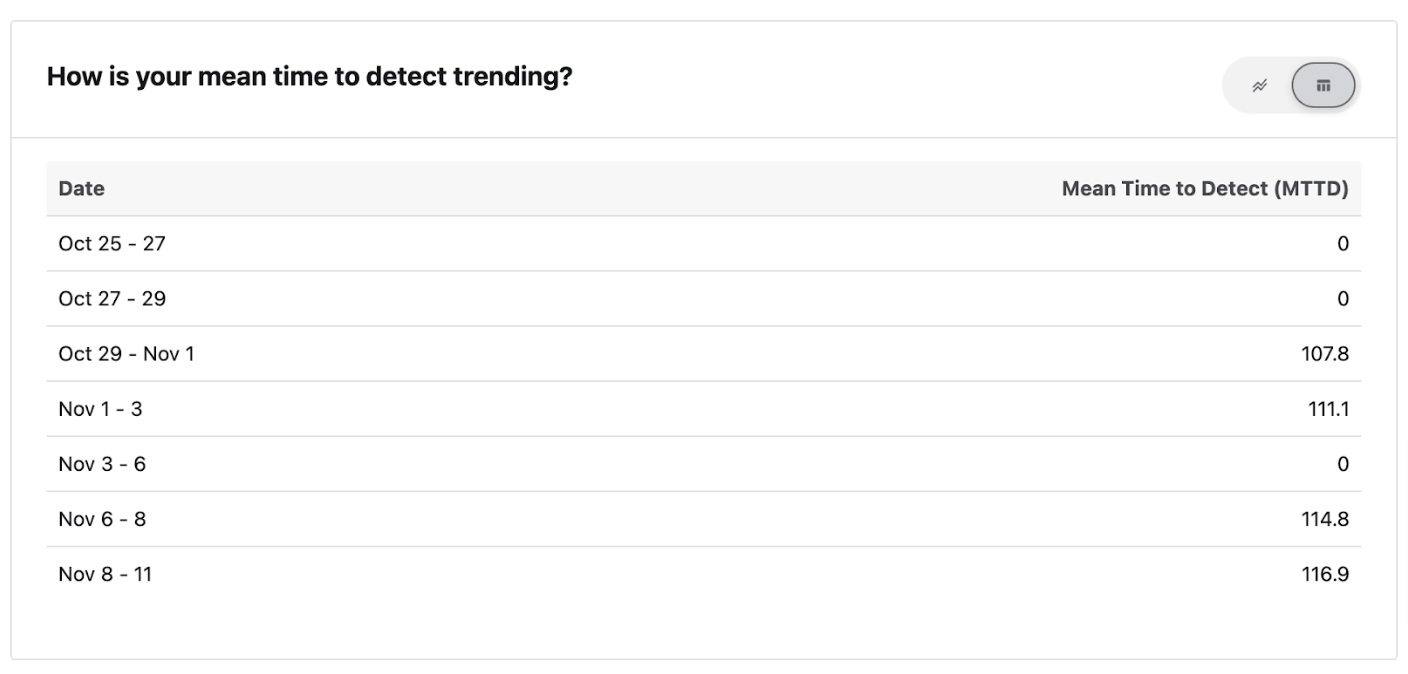
To learn more about the metrics, please refer to Mean Days and Time.